


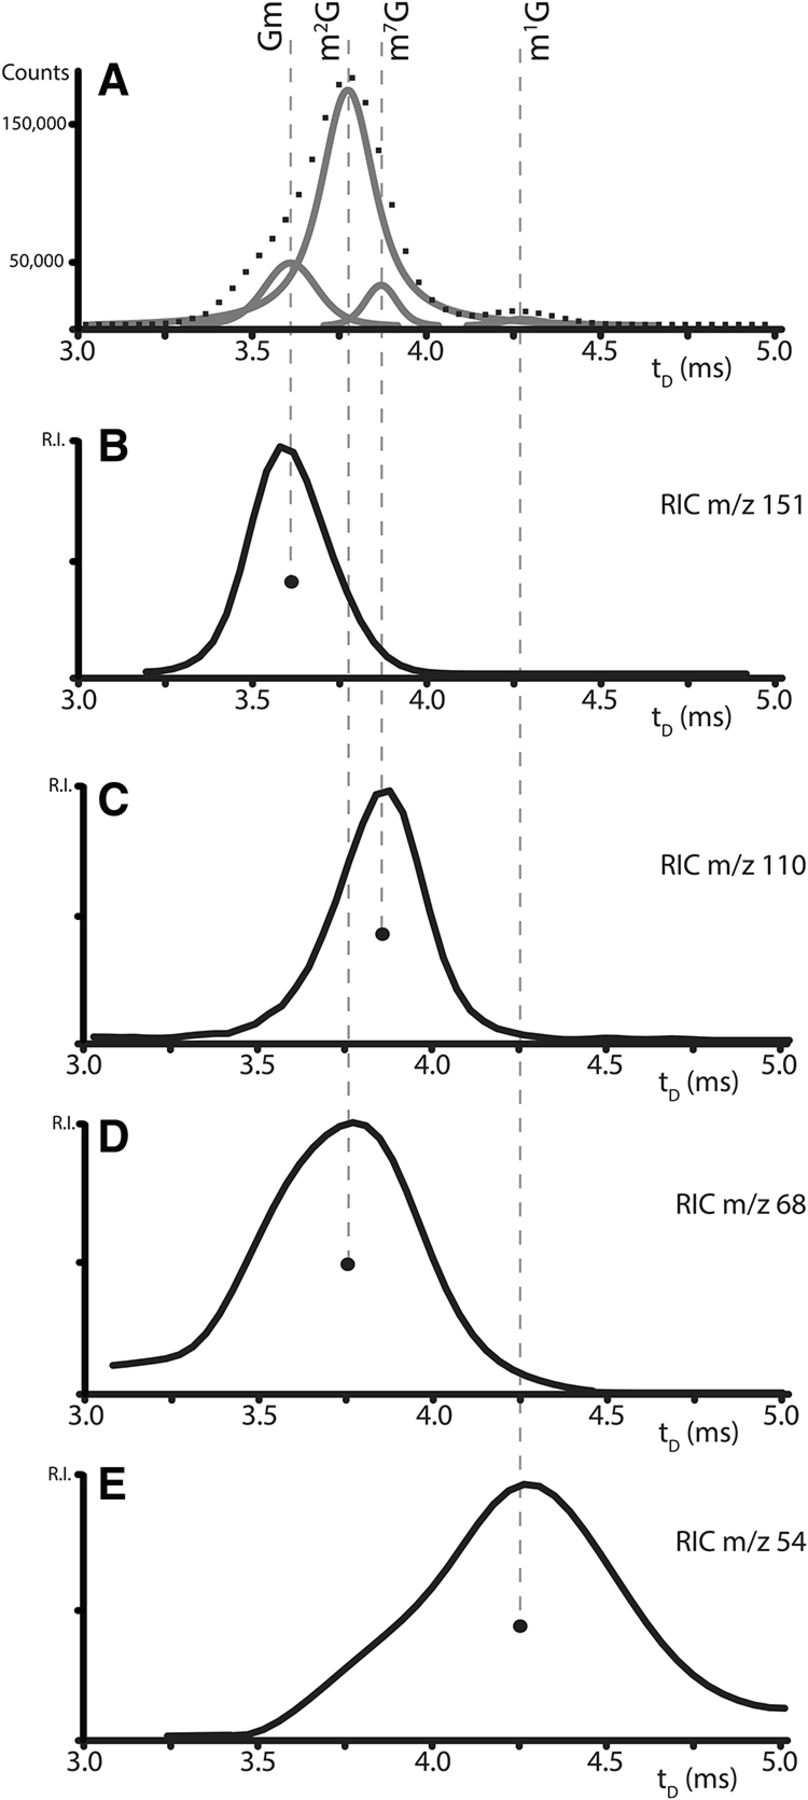
FIGURE 4.
(A) IMS-MS profile of m/z 378 obtained after isolation in the mass-selective quadrupole and separation in the ion mobility element. The dotted line represents the actual profile, while solid lines are individual components provided by Gaussian fitting (see Materials and Methods). (B–E) Reconstructed ion chromatograms (RICs) of unique fragments from individual methyl-G isomers: (B) RIC of m/z 151 unique for Gm; (C) m/z 110 for m7G; (D) m/z 68 for m2G; and (E) m/z 54 for m1G.




