


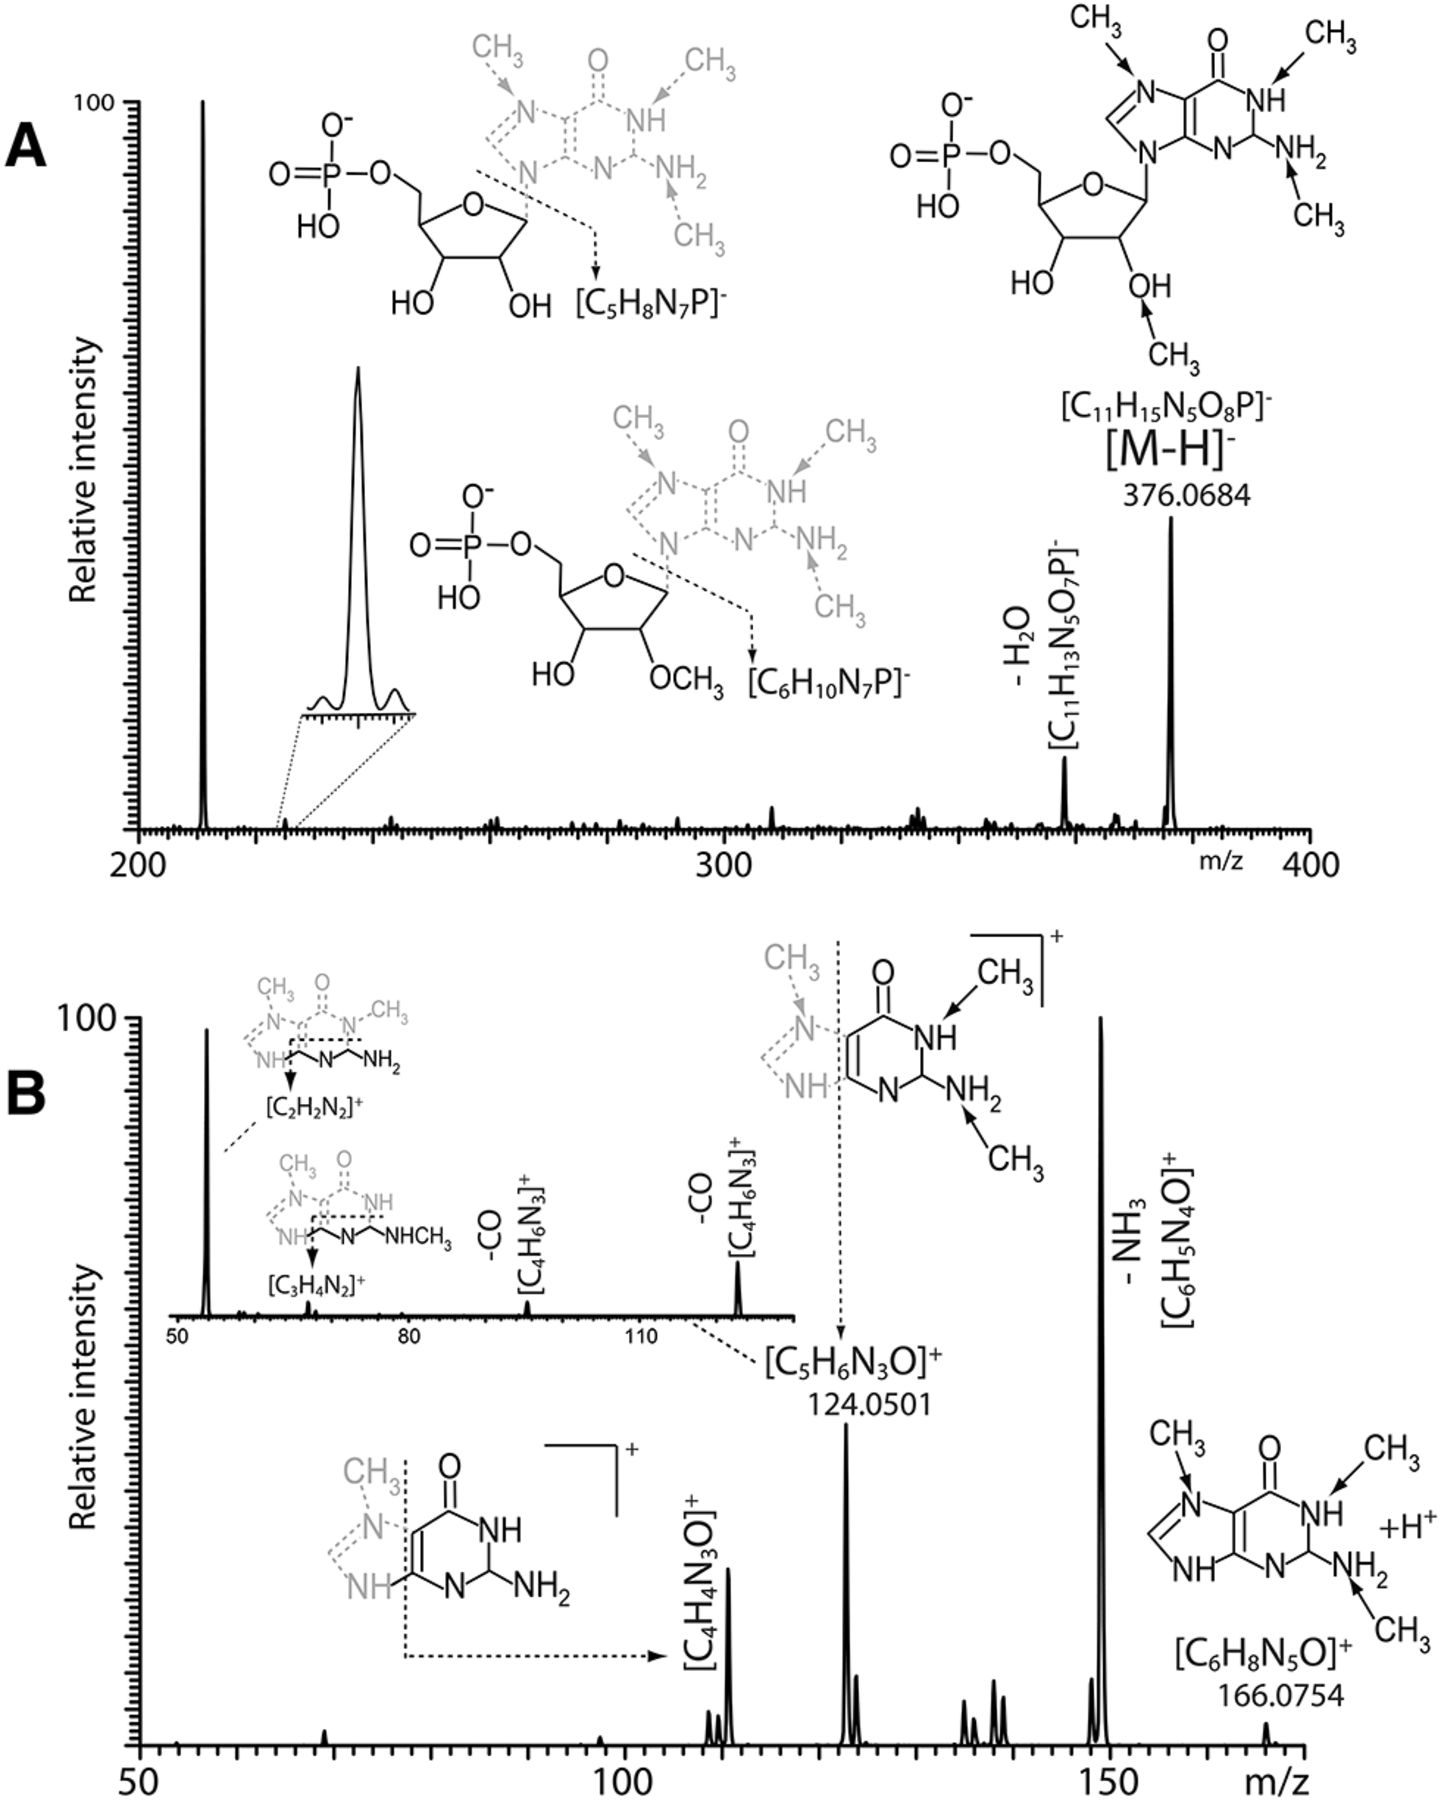
FIGURE 3.
(A) Anionic MS2 spectrum of methyl-G from S. cerevisiae total RNA digest, which was obtained by activating the m/z 376 species observed in Figure 1; (B) cationic MS3 spectrum obtained by activating m/z 378 → 166 →. The inset displays the MS4 spectrum obtained by activating m/z 378 → 166 → 124 →. Solid arrows indicate possible methylated positions; dashed arrows suggest putative cleavages.




