


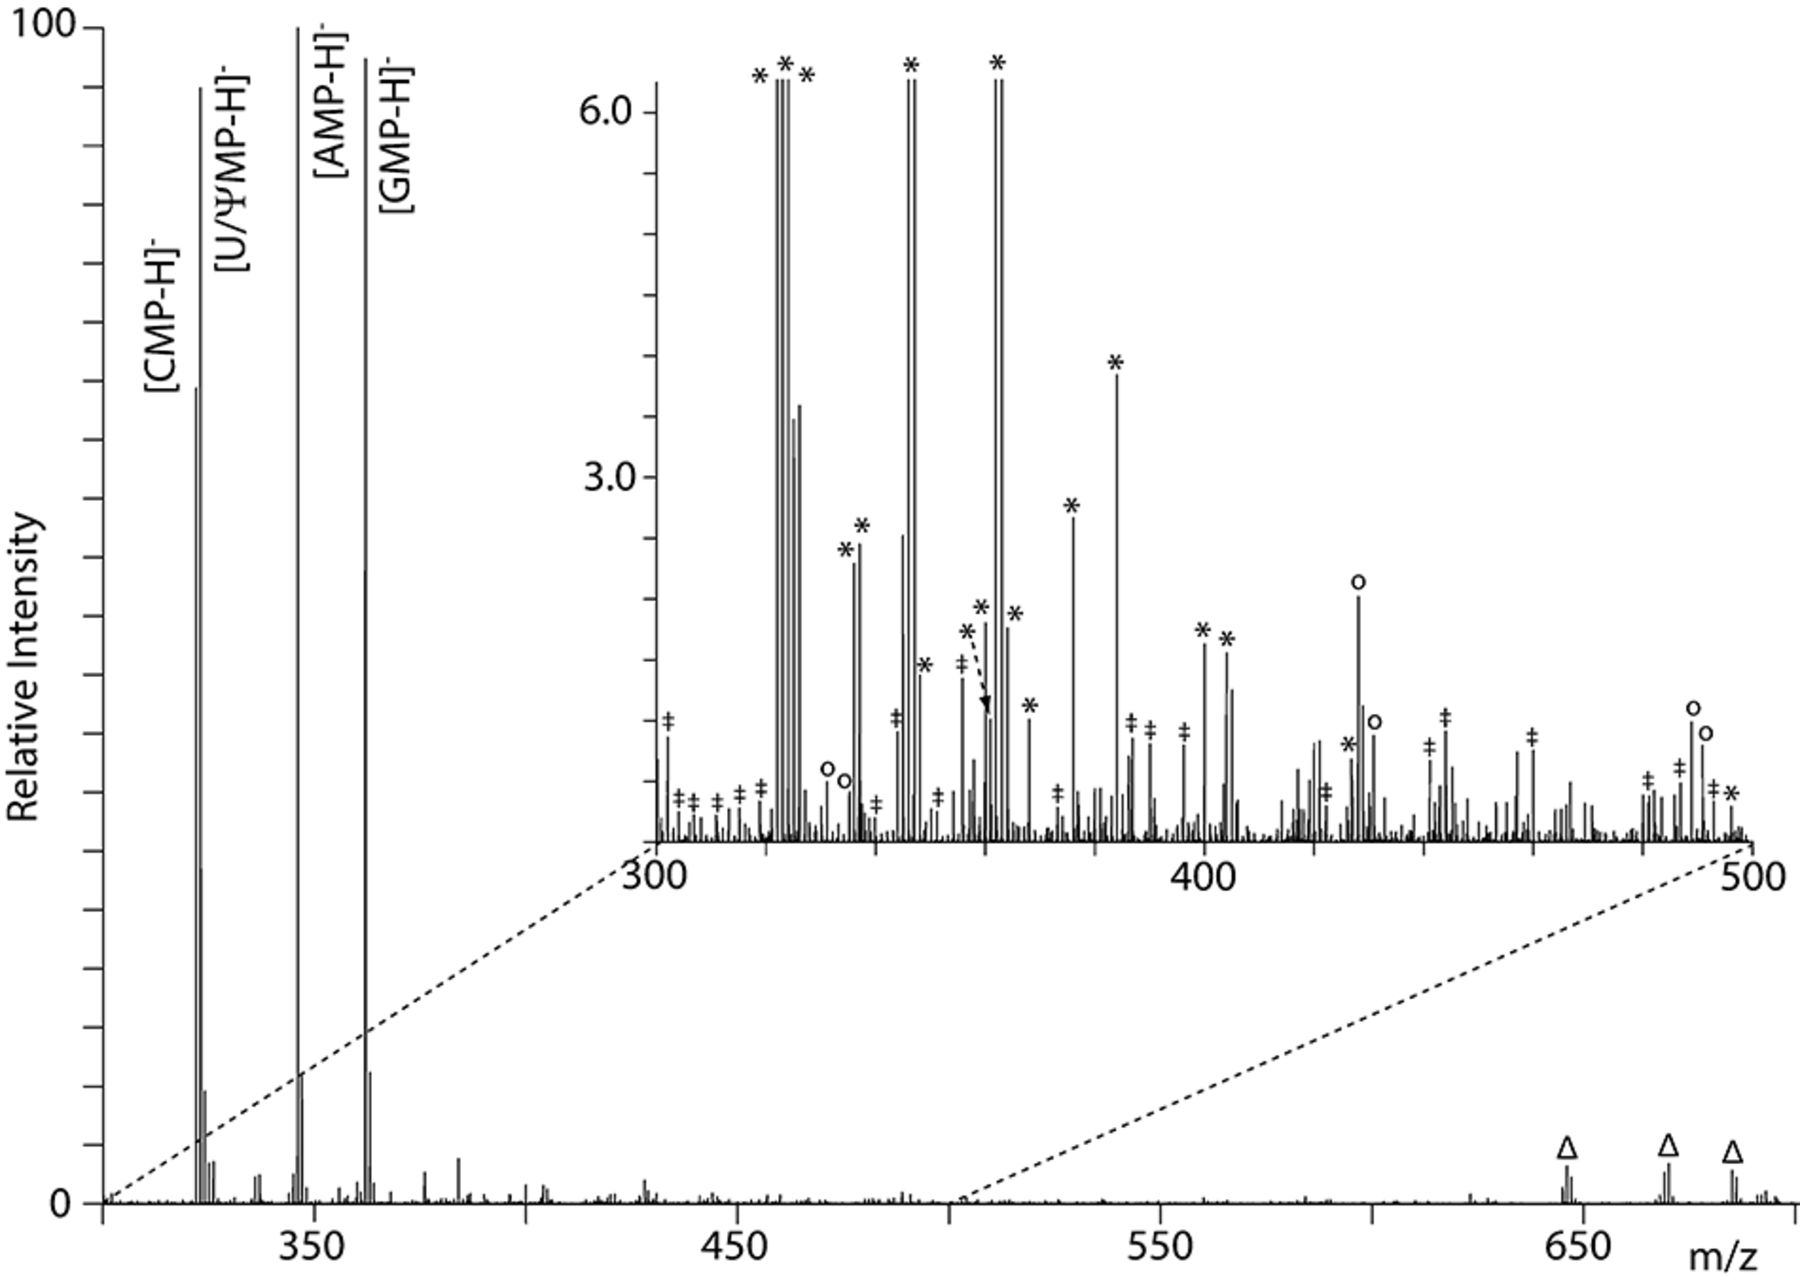
FIGURE 1.
Representative ESI-MS spectrum of total RNA digest obtained from S. cerevisiae grown in YPD medium. The enlargement shows the region containing the majority of the PTMs. Signals marked with (*) are hits from our custom modifications registry; (Δ), proton-bound dimers of the most abundant species in the spectrum; (‡), METLIN hits; (o), species detected also in the blank.




