


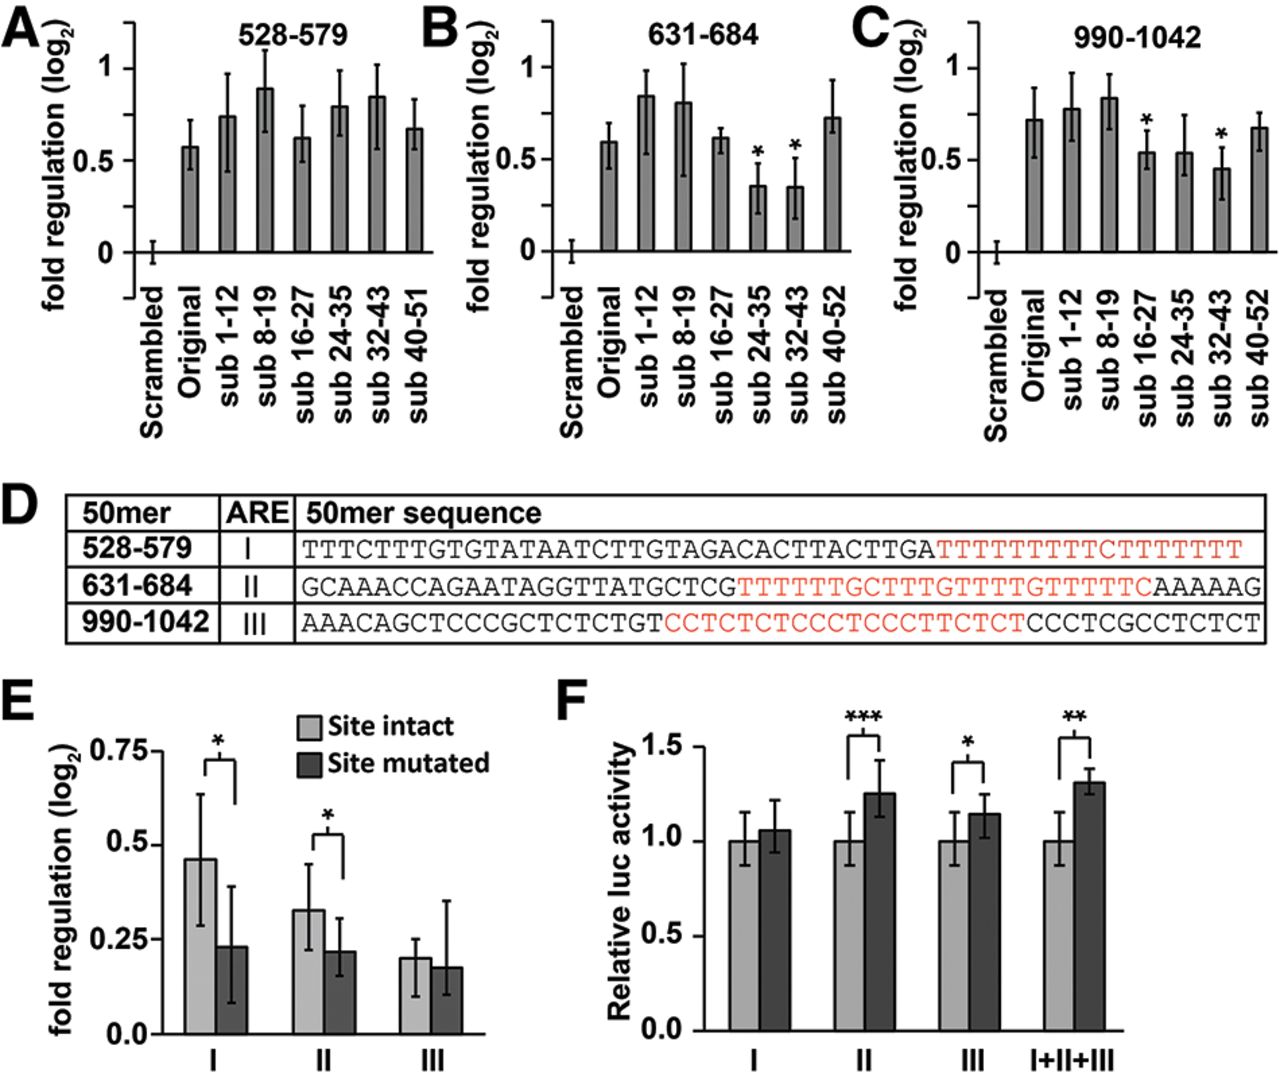
Fine-resolution mapping of positive regulatory sequence elements within the Hmga2 3′ UTR. (A–C) Scanning mutagenesis identifies regulatory sites within 631–684 and 990–1042 50mers (B,C, respectively), but not within 528–579 50mer (A). Reporter assays comparing the original endogenous-sequence 50mers to substitution mutant 50mers, relative to size-matched inert random-sequence controls. Significant reductions (Wilcoxon rank-sum tests) in positive regulatory impact are signified with an asterisk (n = 9). (D) Sequence of three strongest positive 50mers with candidate sequence elements highlighted in red. ARE sequence elements are denoted I, II, and III. (E,F) Reporter assays determining the effect of a targeted deletion of candidate elements from 200mers (E) or full-length Hmga2 (F). Reporter activities of 200mers are shown relative to size-matched random-sequence inert controls; full-length reporters with the targeted deletion are shown relative to an intact Hmga2 3′-UTR reporter. Significant effects on reporter expression were determined using Wilcoxon rank-sum tests (n ≥ 12; P < 0.05, 1 × 10⁻³, and 1 × 10⁻⁵ significance thresholds indicated by *, **, and ***, respectively).




