


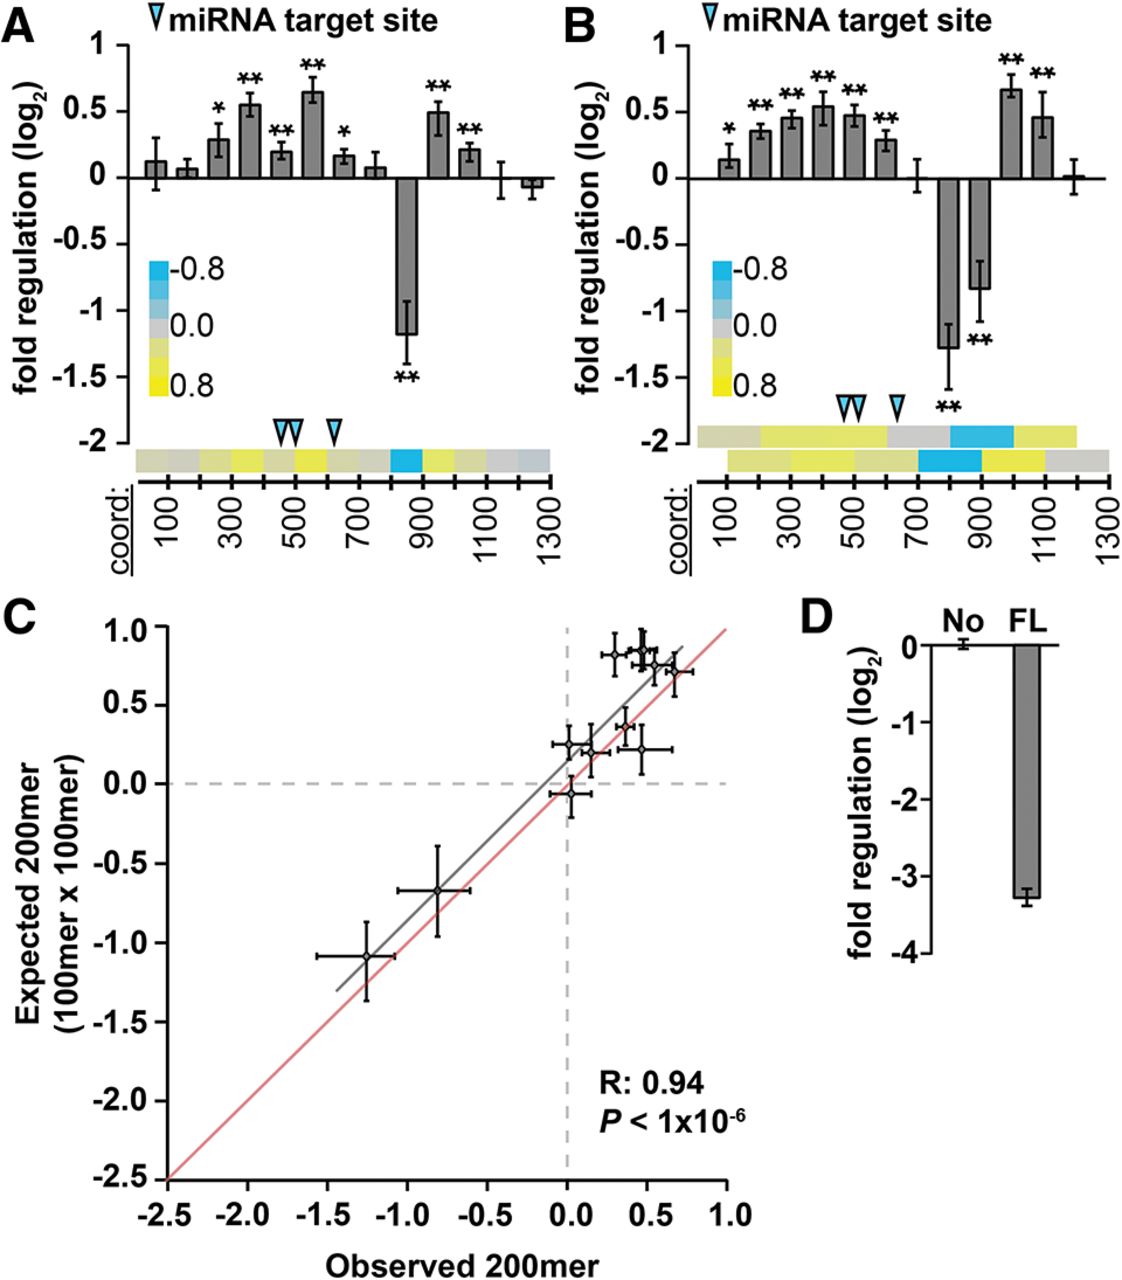
Regulatory sequences impact gene expression independently of one another within the PIM1 3′ UTR. (A,B) Reporter assays measuring regulatory impact of 100- and 200-nt 3′-UTR fragments (A,B, respectively) tiled across the PIM1 3′ UTR at 100-nt intervals (n = 9; P < 0.05 and 1 × 10⁻³ indicated by * and **, respectively, Bonferroni-corrected Wilcoxon rank-sum tests). Heatmaps (bottom of each panel) show same data while illustrating tiling strategy; blue arrows indicate location of target sites for miRNAs expressed in A549 cells. (C) The measured regulatory impact of each 200mer fragment (observed, x-axis) modeled as the product of the regulatory impact of constituent 100mer fragments (expected, y-axis), for mouse PIM1 3′-UTR sequences, otherwise as described in Figure 3C. (D) The full-length PIM1 3′ UTR (FL) is repressive (normalized to a no-3′ UTR control [No], n = 9).




