


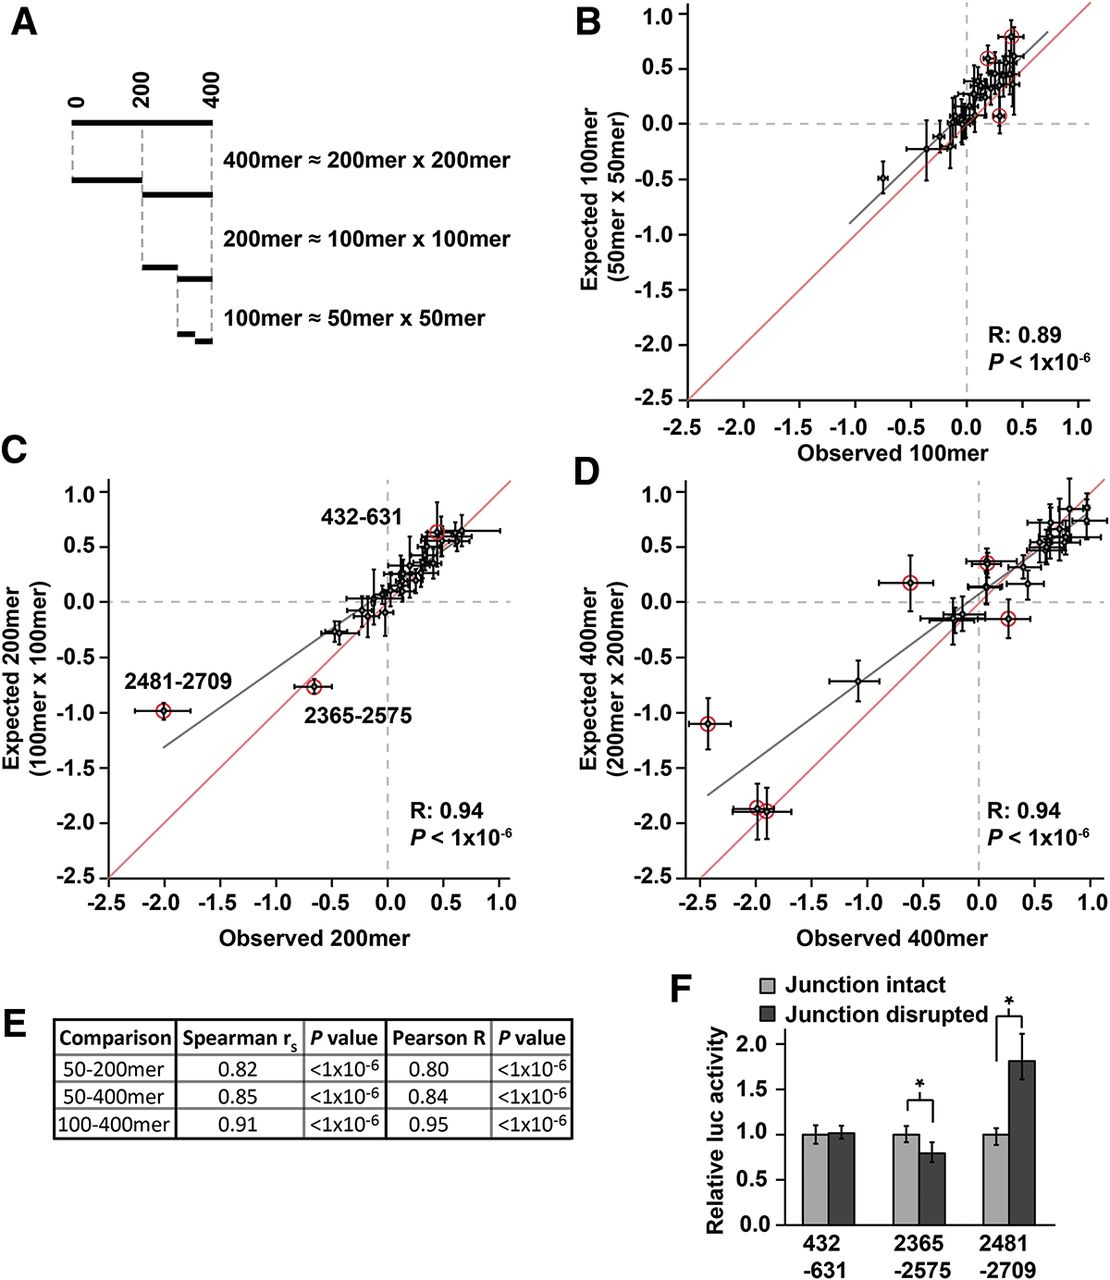
3′-UTR regulatory sequences impact gene expression independently of one another within Hmga2. (A) Depiction of regulatory impact of different 3′-UTR fragments, assuming independent action of regulatory elements. The cumulative effect of regulatory elements within a 3′-UTR fragment is modeled as the product of the regulatory impacts of constituent smaller segments. (B–D) The observed regulatory impact (x-axis) for each 100mer, 200mer, and 400mer fragment compared with the prediction (y-axis) based on the 50mer, 100mer, and 200mer data set, respectively, for the mouse Hmga2 3′ UTR. The gray line represents a Pearson best-fit regression between x- and y-values; for comparison, the red line shows a y = x line. Error bars represent the middle 68% of the data as a nonparametric equivalent to one standard deviation. 3′-UTR fragments that deviate significantly (see Materials and Methods) from the regression are circled in red. (E) Comparison of the observed regulatory impact of 200mer and 400mer 3′-UTR fragments to the prediction using values observed for 50mers (for 200mers and 400mers) and 100mers (for 400mers). Each comparison is summarized with correlation coefficients (Spearman and Pearson) and P values. (F) Sequences located at the junction of adjacent 100mer fragments alter the regulatory behavior of two of the three 200mer fragments whose activity is not well predicted by constituent 100mers (circled red in C). For each 200mer fragment, mutations were introduced at the junction between the two corresponding 100mers. The activity of each mutant derivative was normalized to the original 200mer reporter constructs. Significant difference between intact and disrupted junction constructs was determined with a Wilcoxon rank-sum test (n = 9; * indicates P < 0.05).




