


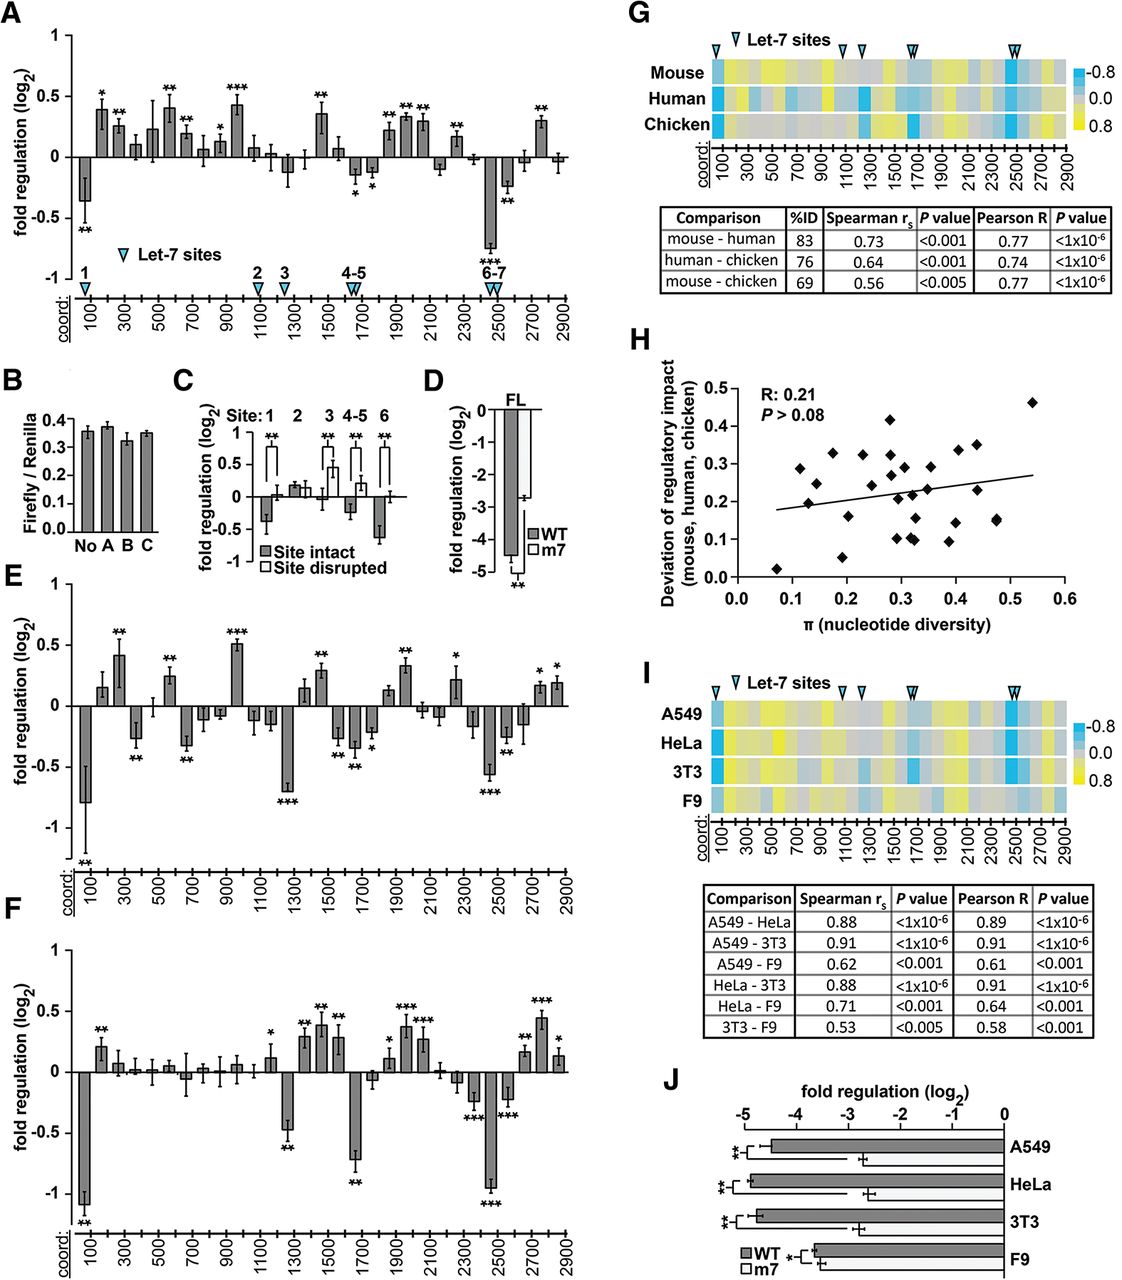
Regulatory sequences in vertebrate Hmga2 3′ UTRs. (A) Reporter assays measuring regulatory impact of tiled 100-nt fragments (100mers) of the mouse Hmga2 3′ UTR. Histogram indicates log2 fold change conferred by 3′-UTR 100mers, relative to random-sequence 100mer reporters (B); significance assessed with Bonferroni-corrected Wilcoxon rank-sum tests (n > 12; P < 0.05, 1 × 10⁻³, and 1 × 10⁻⁵ significance thresholds indicated by *, **, and ***, respectively; error bars indicate the third largest and third smallest values among 12 replicates, approximating 68% of the data as a nonparametric analog of one standard deviation; for measurements with more than 12 replicates, values were selected so that error bars also approximate 68% of the data). The x-axis shows the approximate coordinates of each 3′-UTR sequence; the positions of let-7 miRNA target sites are indicated with blue arrowheads. (B) Reporter assays measuring regulatory impact of a no-3′-UTR control (No) and 100mer 3′-UTR fragments of random sequence (A–C). Three different control sequences mediate regulatory effects equivalent to one another and to the no-3′-UTR control (n = 9; P > 0.05, Wilcoxon rank-sum test). (C) Mutated let-7 sites abrogate the repression of Hmga2 100mer 3′-UTR fragments. Reporter assays comparing the regulatory impact of 100mer fragments containing predicted let-7 target sites (sites numbered as in A) to otherwise identical fragments in which the let-7 target sites were disrupted (n = 9; ** indicates P < 1 × 10⁻³, Wilcoxon rank-sum test). (D) Let-7 mediated repression of the full-length Hmga2 3′ UTR. As in C, comparing full-length Hmga2 3′ UTR constructs (normalized to a no-3′ UTR control) with all let-7 target sites intact (WT) or disrupted (m7) (n = 9, P < 1 × 10⁻³, Wilcoxon rank-sum test). (E,F) Reporter assays measuring regulatory impact of successive 100-nt fragments of human (E) and chicken (F) HMGA2 3′-UTR sequences. Boundaries for human and chicken 3′-UTR fragments are orthologous to mouse coordinates; otherwise as described in A (n = 9). (G) Conservation of regulatory sequence impact. Heat maps (top) illustrate reporter data from A,D,E (color key on right); the positions of let-7 miRNA target sites are indicated with blue arrowheads, as in A. Table (bottom) contains correlation coefficients (Spearman and Pearson) and P values comparing regulation of orthologous 100-nt fragments tiled across the 3′ UTR. (H) Nucleotide diversity (X-axis) is not well-correlated with divergence in regulatory impact of different 3′-UTR fragments from human, mouse, and chicken (Pearson R = 0.21, P > 0.08). (I) Impact of Hmga2 3′-UTR regulatory sequences compared in different cell types. Reporter assays (data depicted as heat maps, as described above) comparing regulatory impact of mouse 100mer 3′-UTR reporters performed in indicated cell lines. Each pair-wise comparison between reporter data is summarized with Spearman and Pearson correlation coefficients along with P values. (J) Regulatory effect of full-length Hmga2 3′ UTRs compared in different cell types. Full-length Hmga2 3′-UTR constructs (normalized to a no-3′-UTR control) with all let-7 target sites intact (WT) or disrupted (m7) in different cell types (n = 9; * and ** indicate P < 0.05 and P < 1 × 10⁻³, respectively, Wilcoxon rank-sum test).




