


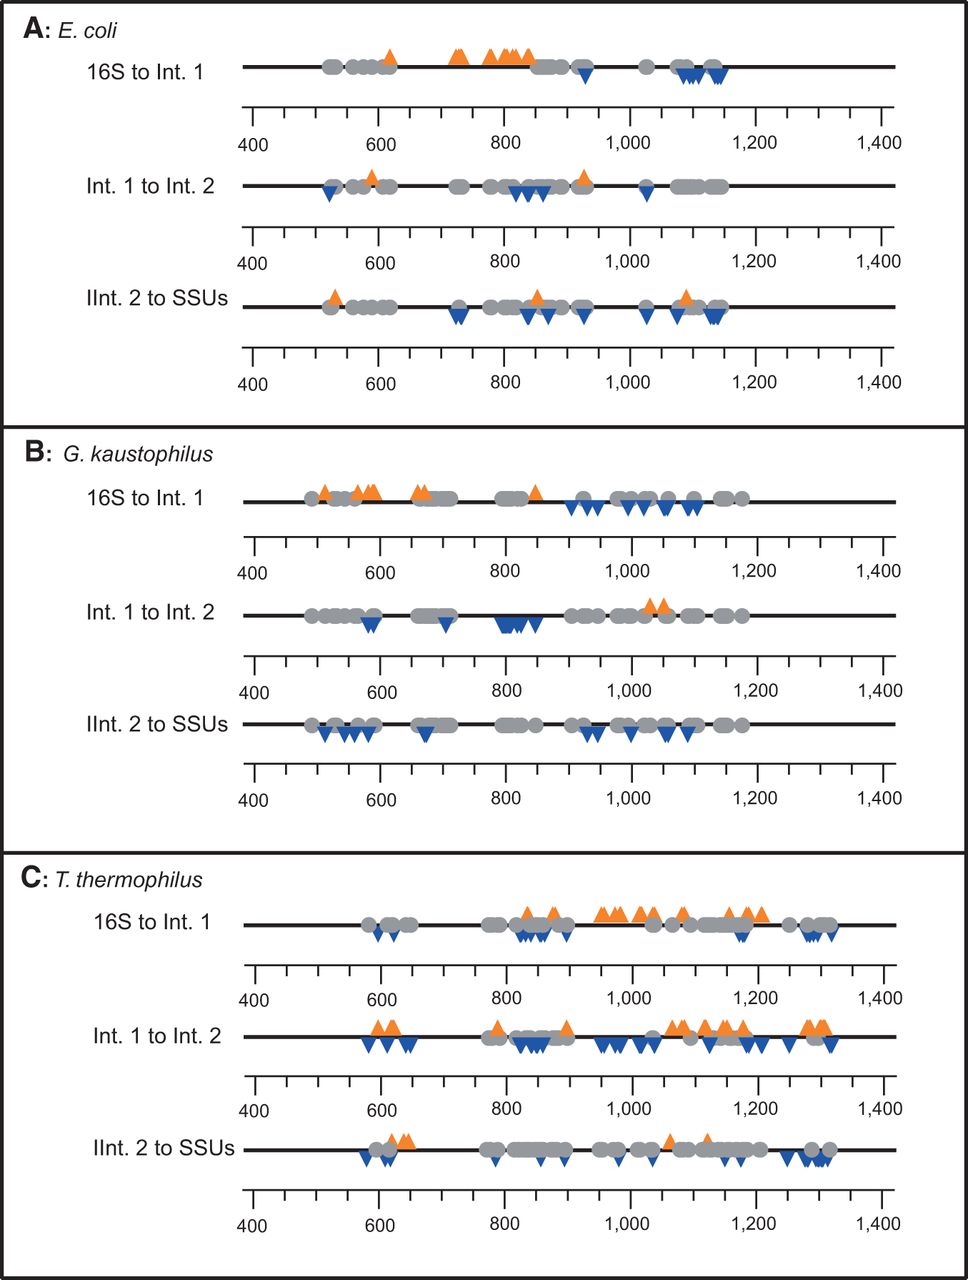
FIGURE 6.
Changes in RNase T1 cleavage intensity greater than twofold for each nucleotide are plotted linearly with Enhancements indicated by orange triangles, Protections indicated by blue triangles, and No Change shown in gray circles for (A) E. coli, (B) G. kaustophilus, and (C) T. thermophilus.




