


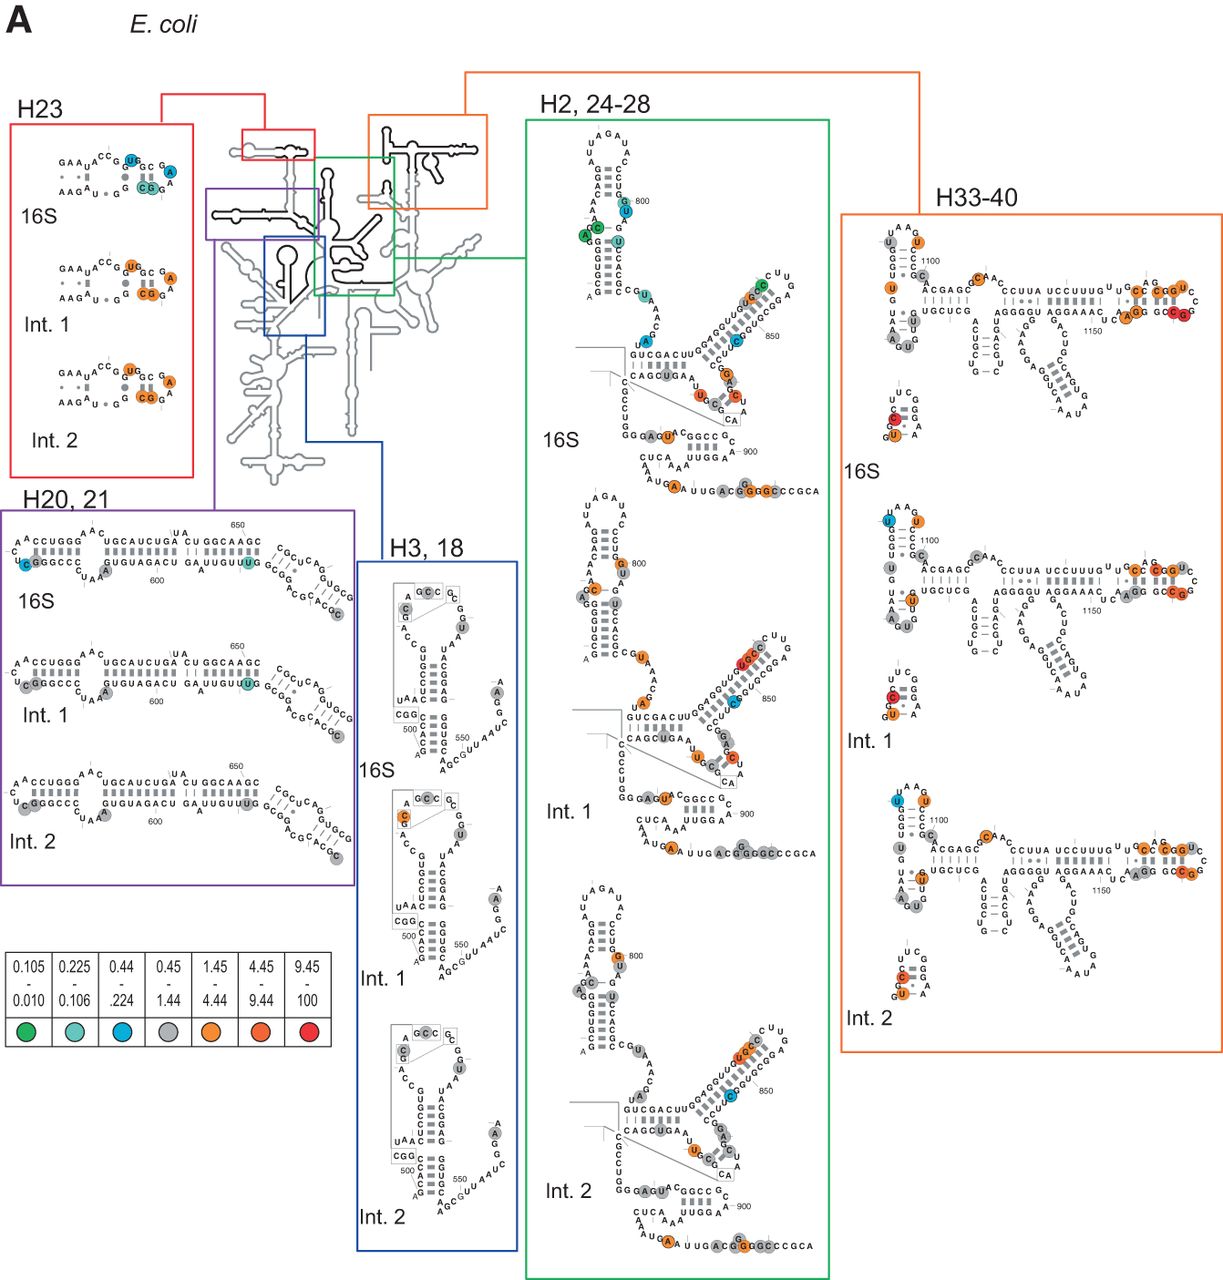


RNase T1 cleavage intensities plotted onto 2° structures of 16S rRNA. Gray circles indicate cleavage events similar to SSUs (0.45- to 1.44-fold). Enhancements in RNase T1 cleavage events relative to SSUs are shown as light orange circles (1.45- to 4.44-fold), dark orange circles (4.45- to 9.44-fold), and red circles (9.45- to >100-fold). Protections from RNase T1 cleavage events are shown as blue circles (0.44- to 0.224-fold), blue-green circles (0.225- to 0.106-fold), and green circles (0.105- to >0.01-fold). (A) E. coli rRNA conformational differences plotted onto the 2° structure of E. coli for 16S rRNA, intermediate 1 (4°C) and intermediate 2 (25°C). Circles represent relative intensity of primer extension bands to the optimal reconstitution temperature (42°C). (B) G. kaustophilus rRNA conformational differences plotted onto the 2° structure of the closely related organism Bacillus subtilis (due to no 2° structure being available for G. kaustophilus, with nucleotide changes as necessary) for 16S rRNA, intermediate 1 (4°C) and intermediate 2 (37°C). Circles represent relative intensity of primer extension bands to the optimal reconstitution temperature (55°C). (C) T. thermophilus rRNA conformational differences plotted onto the 2° structure of T. thermophilus for 16S rRNA, intermediate 1 (4°C) and intermediate 2 (42°C). Circles represent relative intensity of primer extension bands to the optimal reconstitution temperature (62°C). (Figure continues on following pages.)




