


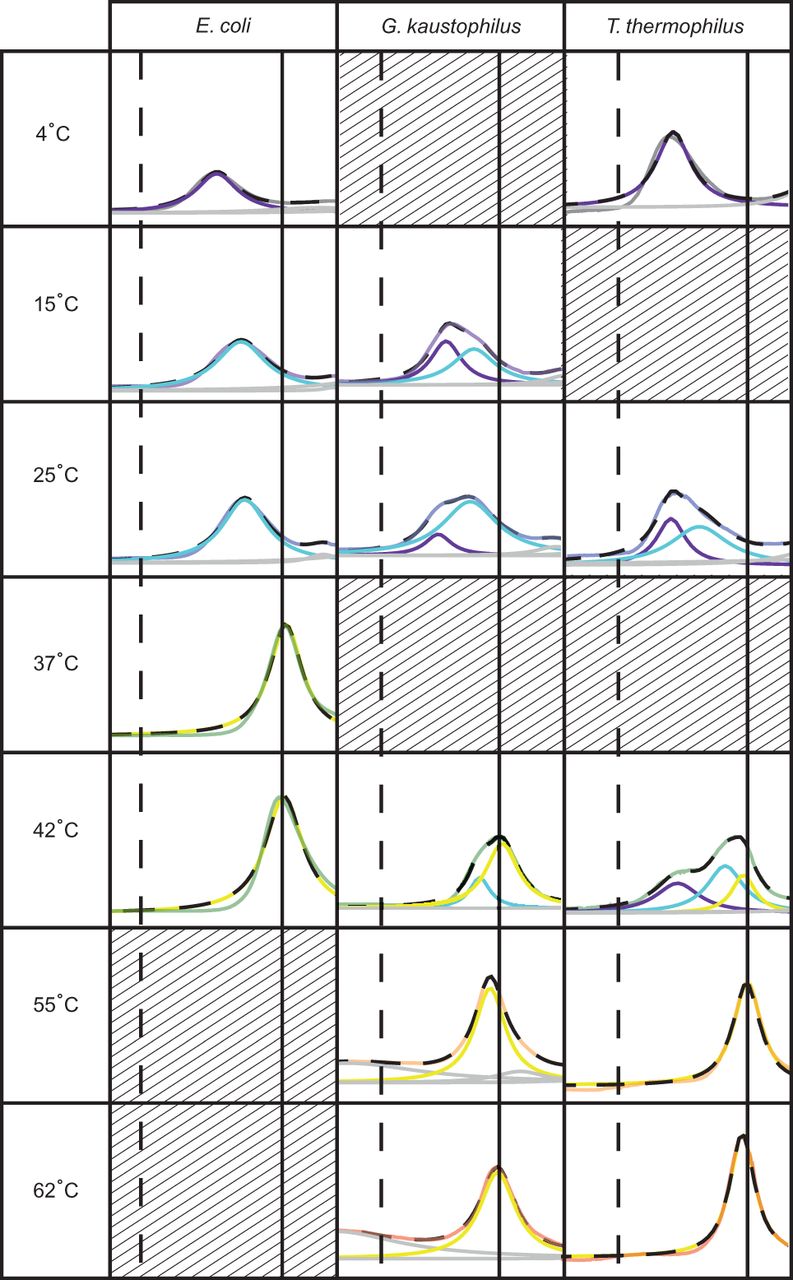
QtiPlot analyzed sucrose-gradient profiles of E. coli, G. kaustophilus, and T. thermophilus. Sucrose-gradient sedimentation scans are shown in the background with coloring the same as in Figure 3 with the addition of 4°C in gray. Lorentzian fit curves of sucrose-gradient sedimentation profiles are shown in black dashed lines with Lorentzian distribution curves color coded indicating Intermediate 1: purple, Intermediate 2: cyan, SSUs: yellow, and undefined peaks: light gray. The vertical dotted lines represent where 16S rRNA sediments in the gradient while the solid vertical lines indicate the location of 30S subunits. Sucrose-gradients presented are representative of those observed in multiple experiments; however, only six gradients were compared at any one time. Hashed lines in boxes indicate temperatures not tested in the given experiment.




