


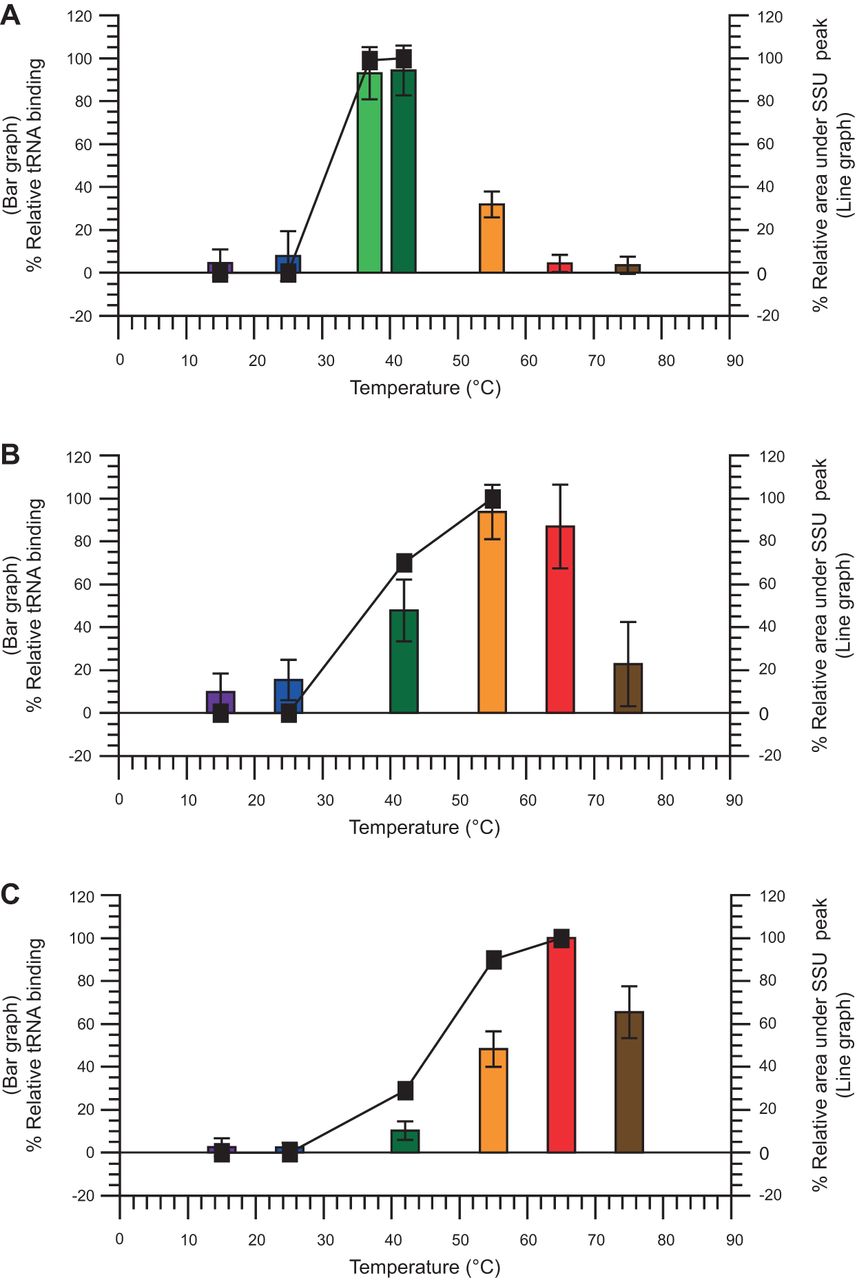
FIGURE 3.
Percent relative tRNA binding with bar graph colors indicating the temperature of reconstitution (15°C: purple, 25°C: blue, 37/42°C: light green/green, 55°C: orange, 65°C: red, and 75°C: brown) and area under SSU peaks (line graph). Both percent tRNA binding and percent area under SSU peak were calculated based on reconstitution at optimal temperature for each organism. (A) E. coli, (B) G. kaustophilus, (C) T. thermophilus.




