


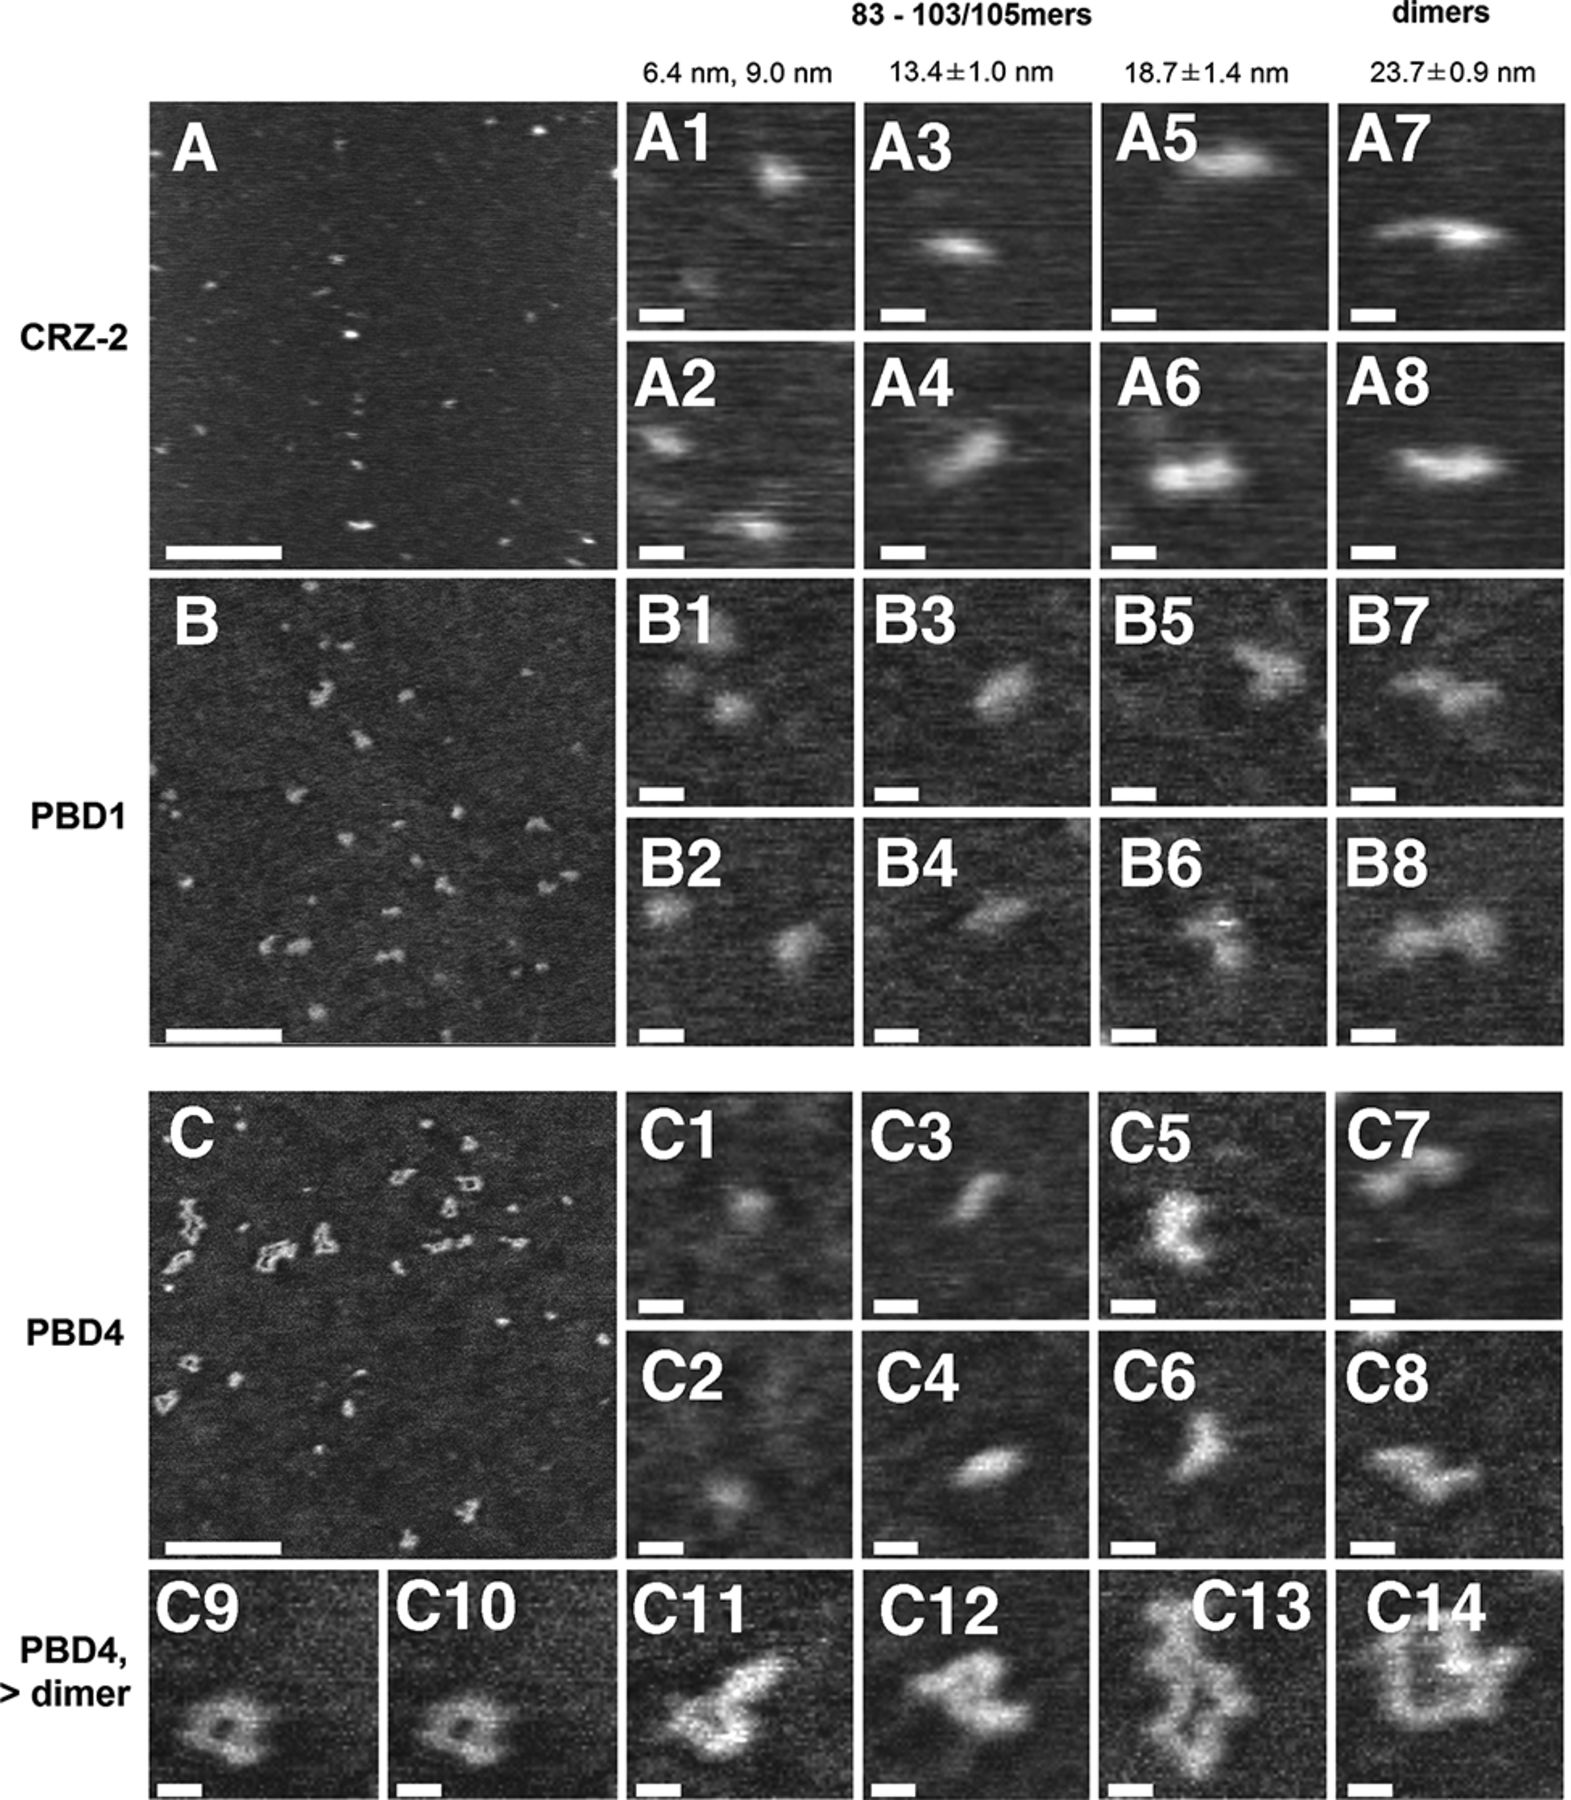
AFM images of RNA: CRZ-2 (A, a1–a8), PBD1 (B, b1–b8), and PBD4 (C, c1–c14). Scale bars: 100 nm (A–C), 10 nm (a1–c14); height scale 1 nm in all images. RNA chains have typically a height of ∼0.4 nm in the AFM images. Overview scans (A–C) show a mixture of RNA chains of different contour length LC for all three sequences investigated. Analysis of contour-length histograms (see Supplemental Fig. S5 and S6) for CRZ-2, PBD1, and PBD4 allowed association of most of the observed RNA chains with the species listed in Table 2 (as indicated in the figure). This procedure failed for two shortest species (a–c 1,2) and the one having a contour length ∼18.7 nm (a–c 3,4), as the calculated numbers of bases did not match any entry of this table (see text for a detailed discussion).




