


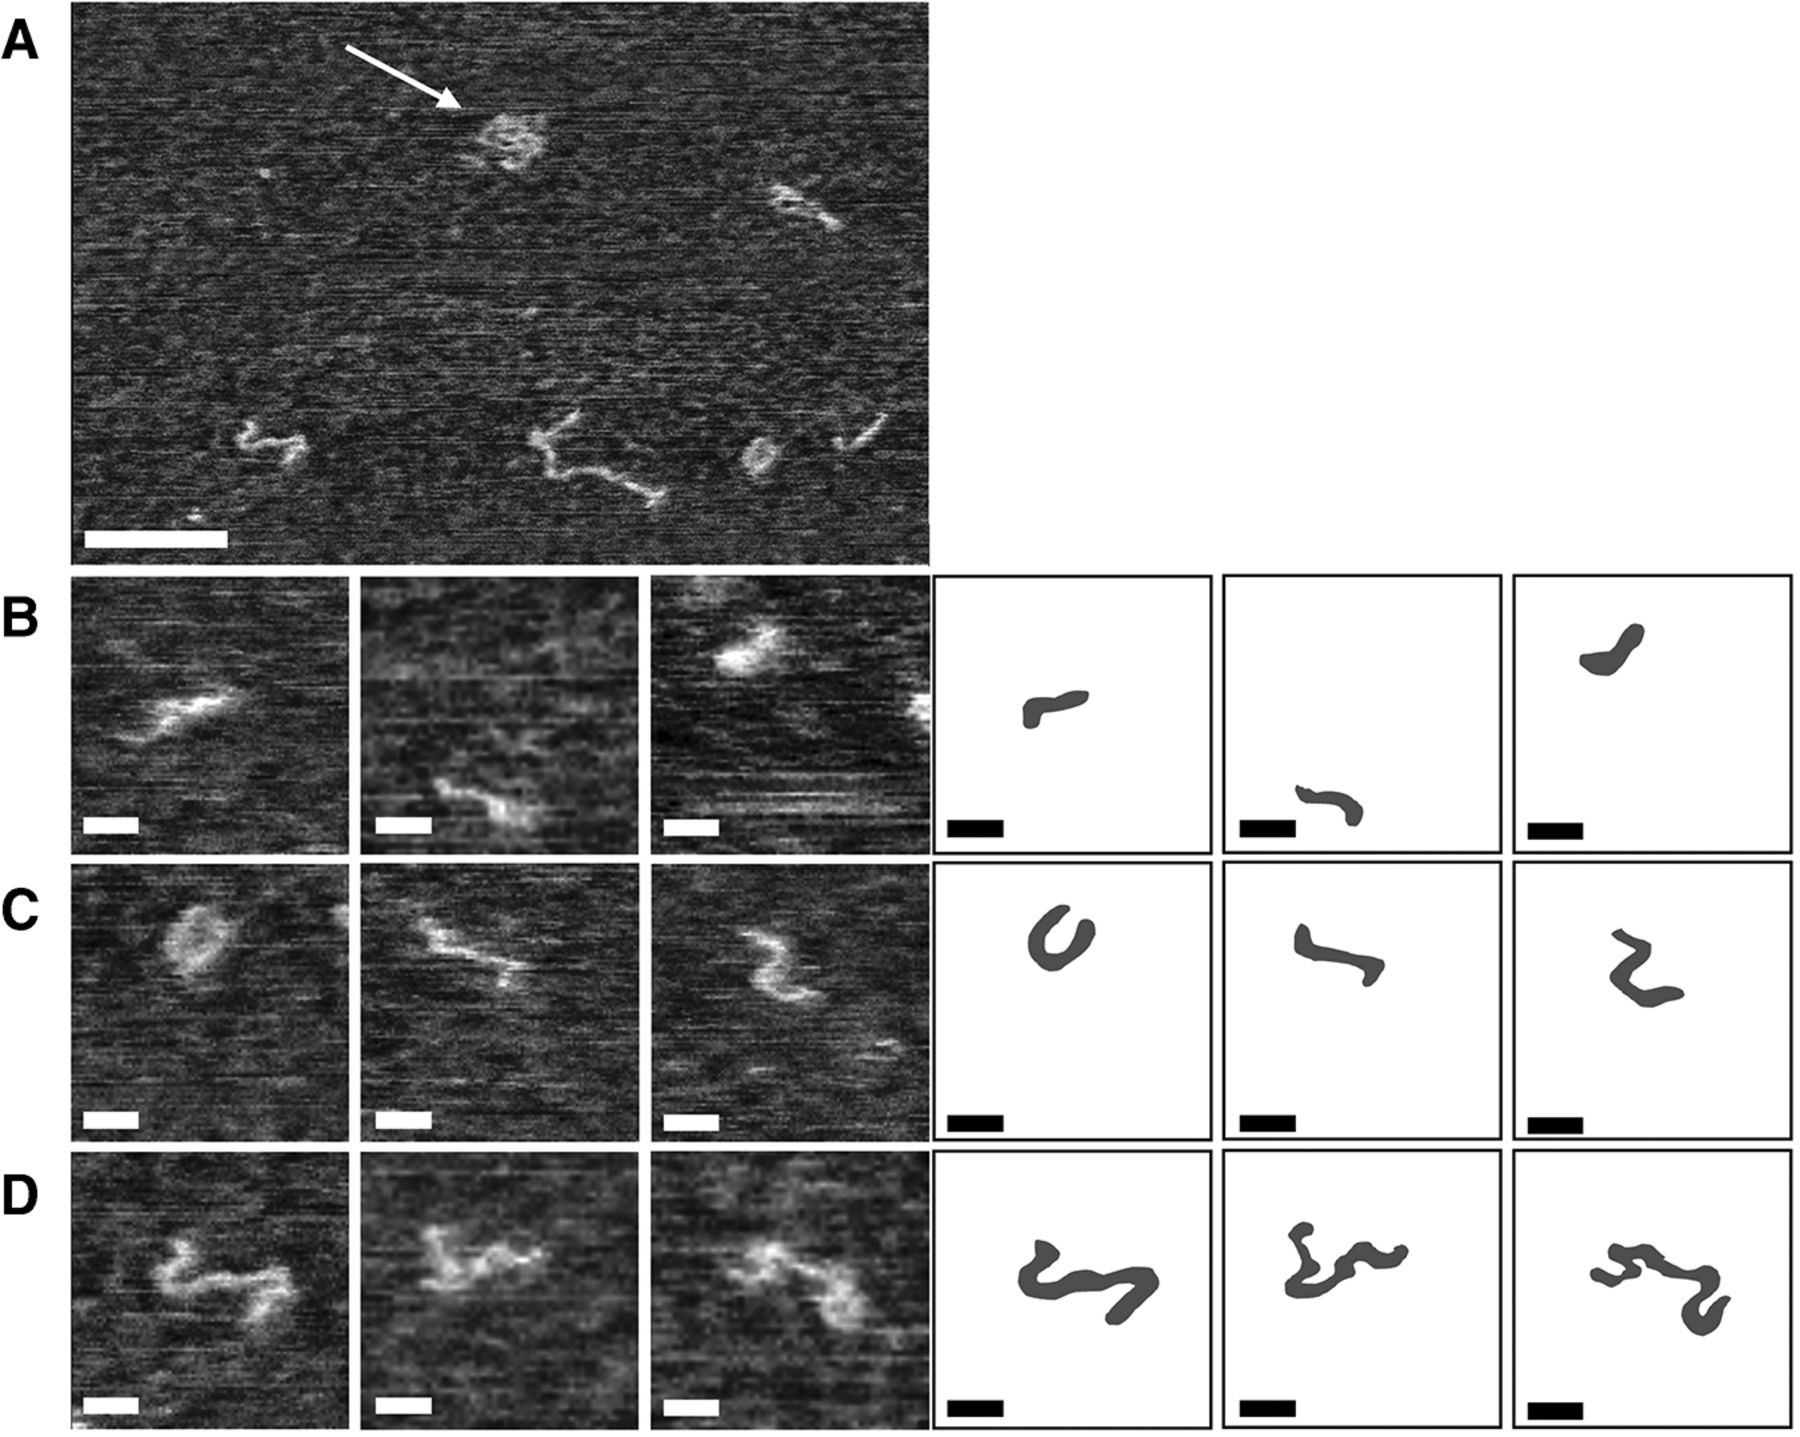
Tapping mode (TM) AFM phase images (range: 0°–30°) of the reaction products resulting from incubation of the l-83mer (isolated from CRZ-2 system) in cleavage/ligation buffer. For AFM analysis, samples were precipitated and resolved in 25 mM EDTA and 3.5 M urea (semidenaturing conditions). Scale bars: 50 nm (A), 10 nm (B–D). The overview scan (A) shows RNA chains in coiled (white arrow) and unwrapped conformation. High-resolution TM images (B–D) allow investigation of the internal structure of 83mers (B), dimers (C), and trimers (D). For convenience, schematics have been included on the right side to help with the interpretation of the AFM images. The corresponding height images are given in Supplemental Figure S7.




