


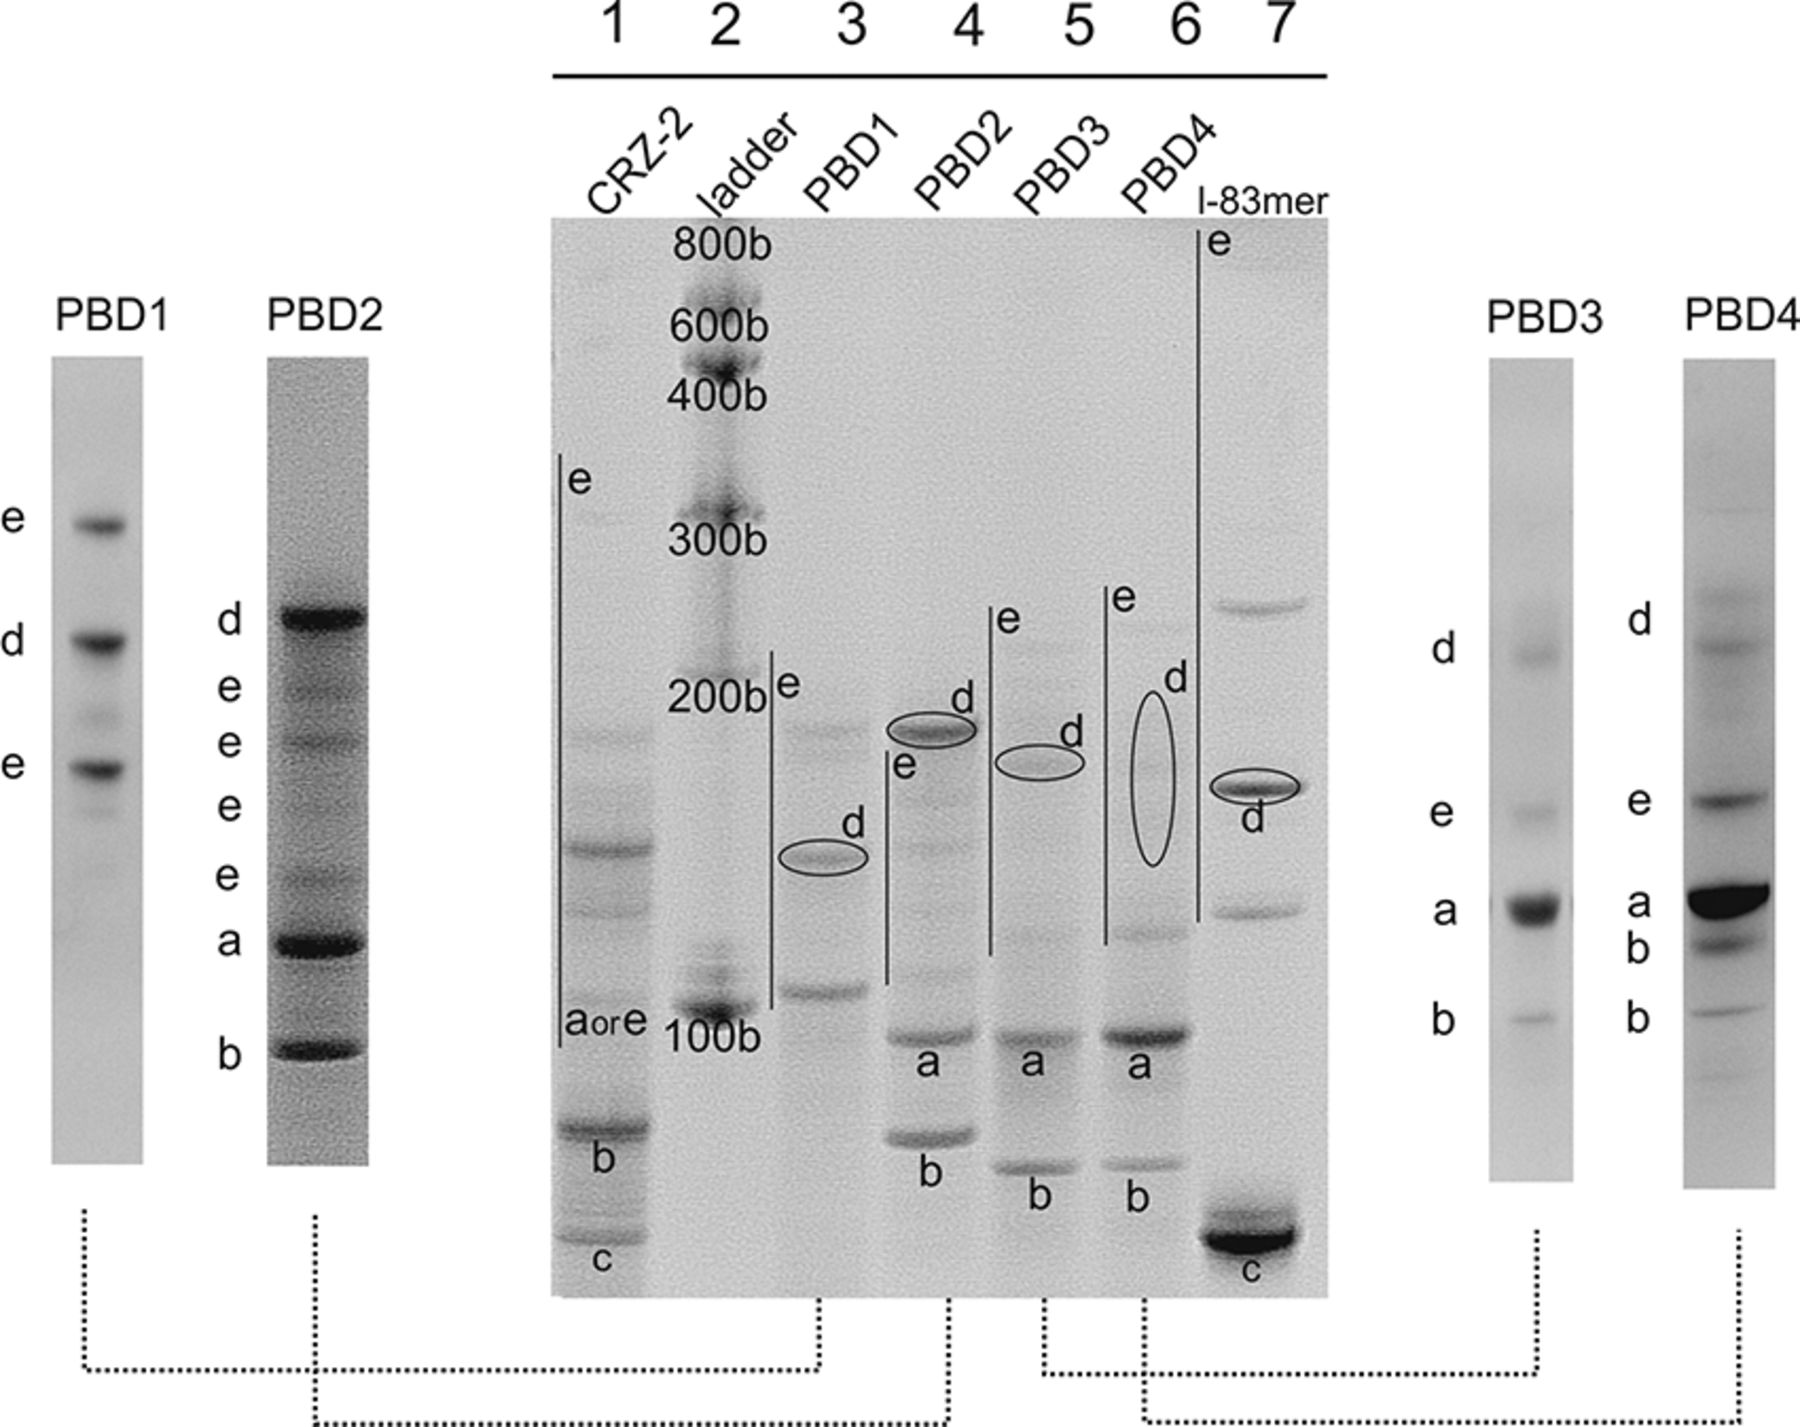
Analysis of self-processing reactions of sequences PBD1-4, CRZ-2, and the linear 83mer (l-83mer) in a 15% denaturing polyacrylamide gel, lane 2: RNA size standard. For better visualization of individual bands, self-processing reactions of PBD1–PBD4 were analyzed separately with a higher amount of sample loaded onto the gel (separate lanes left and right to the gel. Note that large scale analysis was carried out separately for each of the designed RNAs PBD1–PBD4. Therefore, the relative positions of bands are not directly comparable between individual gels. Compare also Supplemental Figure S3. Bands were assigned as follows: full-length transcripts (a); cleavage intermediates (5′- or 3′-truncated transcripts) (b); final cleavage product (5′- and 3′-truncated transcripts) (c); cyclic RNA resulting from intramolecular ligation of species c (d); concatemers resulting from intermolecular ligation of species b and c (e).




