


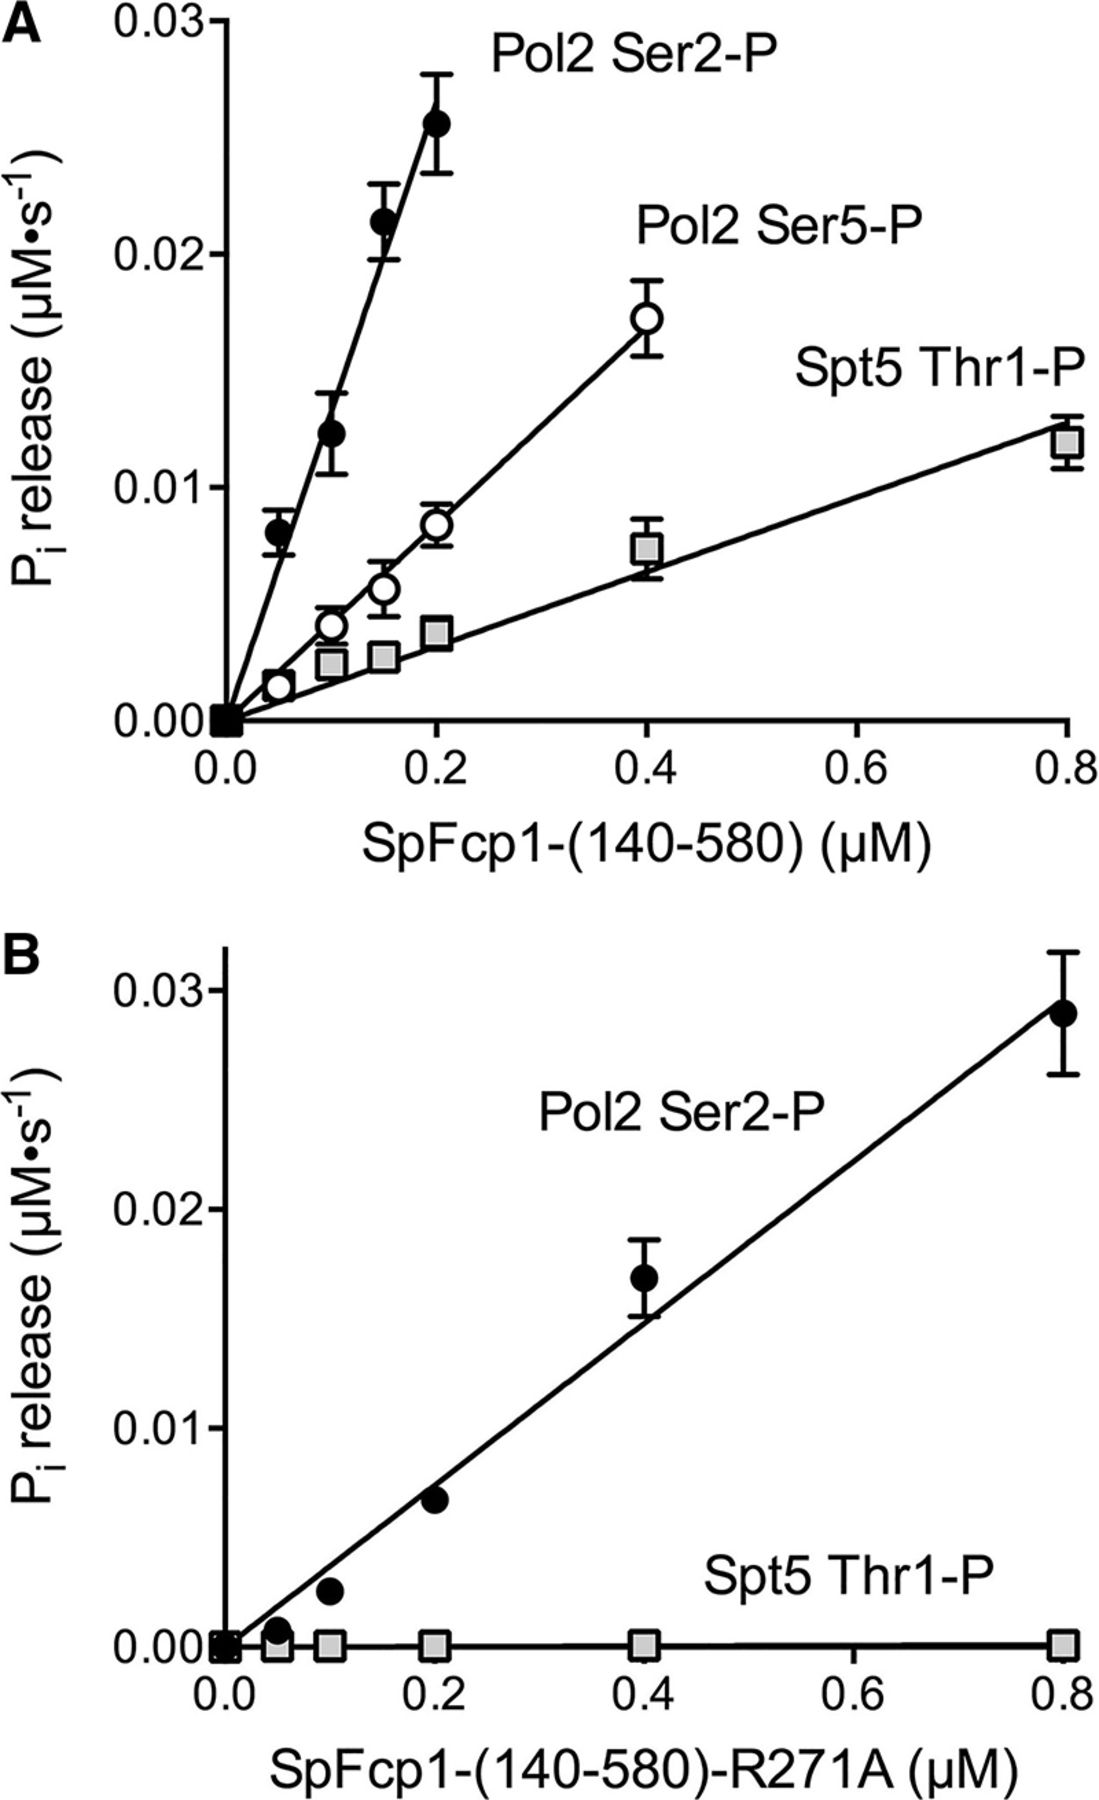
FIGURE 5.
Spt5 CTD threonine phosphatase activity of SpFcp1. (A) Phosphatase activity of SpFcp1-(140–580) with the indicated Pol2 CTD Ser2-PO4, Ser5-PO4, or Spt5 CTD Thr1-PO4 peptide substrates was assayed as described in Materials and Methods. Phosphate release (normalized to reaction time) is plotted as a function of input SpFcp1-(140–580) concentration. (B) Phosphatase activity of SpFcp1-(140-580)-R271A with the Pol2 CTD Ser2-PO4 and Spt5 CTD Thr1-PO4 peptide substrates is plotted as a function of enzyme concentration. Each datum in the graphs is the average of three independent experiments (that were each performed in triplicate) ± SEM. The data were fit by linear regression in Prism.




