


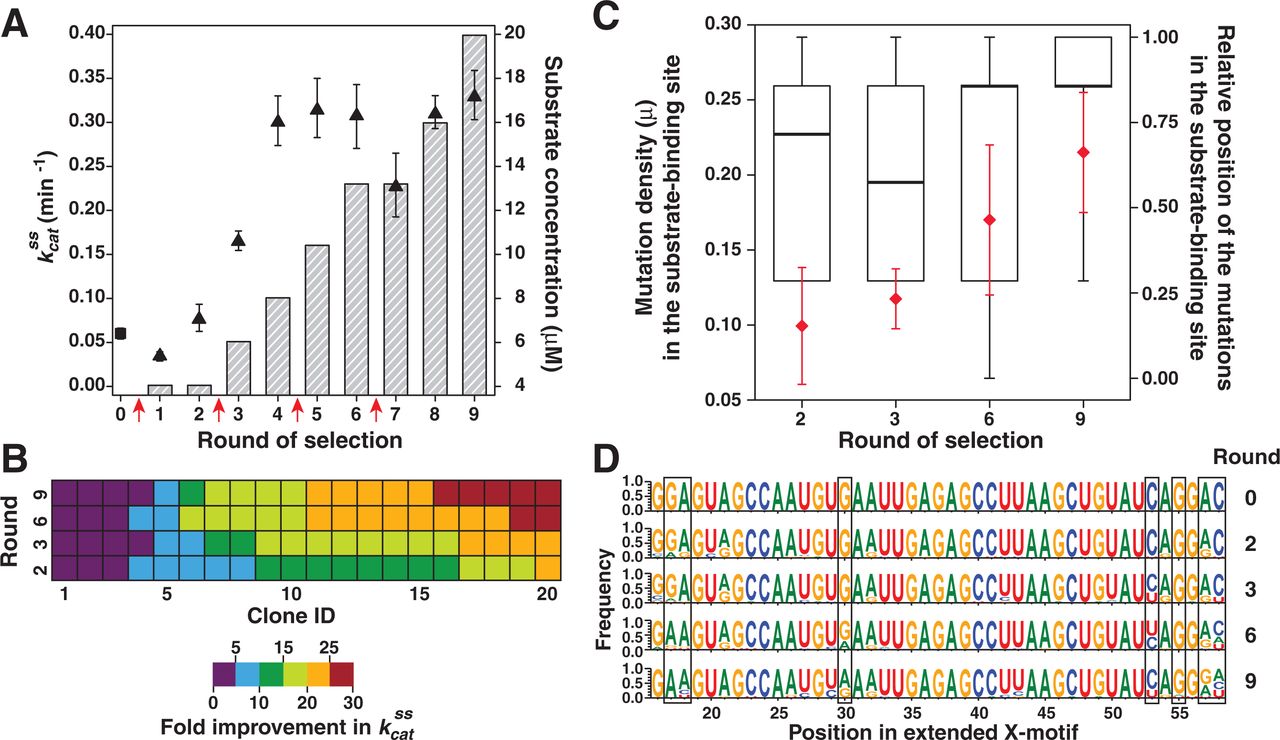
In vitro evolution of the extended X-motif. (A) Multiple-turnover activity of the selected libraries at high mutation rate (1.6 mutations per gene) in different rounds of selection. The kcatss was determined for the parental extended X-motif (square) and the selected library (triangle). Steps at which new genetic diversity was introduced by random mutagenesis are indicated by red arrows. The total concentration of substrate RNA (fluorogenic and nonfluorogenic) used in the selection is represented by the dashed bars. The concentration of fluorogenic substrate was constant in all rounds (4 µM). The values are the mean of at least three independent measurements and error bars correspond to ±1 standard deviation. (B) Activity of cloned variants. The kcatss of 20 variants from rounds 2, 3, 6, and 9 was tested and normalized using the kcatss of the nonextended X-motif. The clones were ordered and numbered (ID) according to their kcatss. (C) Density and position of mutations in the substrate-binding site throughout the evolution process. The red diamonds represent the mutation density, μ, which is the average number of mutations in the substrate-binding site (SBS) divided by the length of the SBS, calculated for the rounds of selection 2, 3, 6, and 9. Error bars shown in red correspond to ±1 standard deviation. In addition, for each tested round of selection, the relative position (RP) of the mutations was calculated using RP = (n − 1)/(l − 1), where n is the position of the residue in the SBS starting the count from the residue the closest to the active site and l is the length of the SBS. The relative position can vary between 0 (mutation at the positions the closest to the active site) and 1 (mutation at the positions the furthest to the active site, therefore at the extremity). Results are shown as a box and whisker plot where the bold line represents the median; the lower and upper limits of the box, respectively, correspond to the first and third quartile; and the whiskers spread from the maximum to the minimum RP values. (D) Sequence evolution. For rounds 2, 3, 6, and 9, the 20 clones characterized in B were sequenced and, after sequence alignment, a logo representation generated using WebLogo3.3 (http://weblogo.threeplusone.com).




