


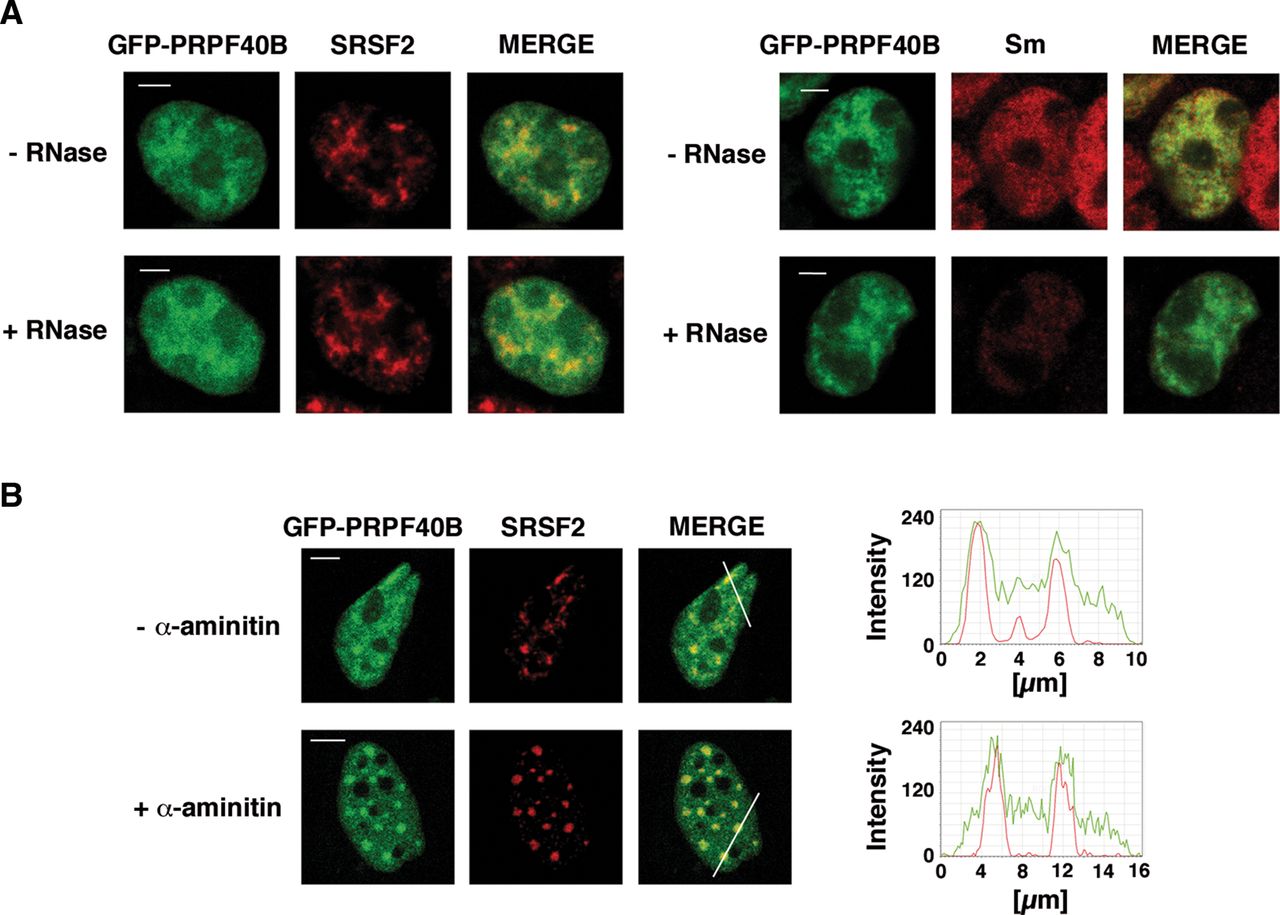
Colocalization of PRPF40B with nuclear speckles is not perturbed following RNase treatment or transcription inhibition. (A) After EGFP-PRPF40B expression, HEK293T cells were treated with RNase A. SRSF2 (left panel) and Sm (right panel) labeling were used as negative and positive controls, respectively. Individual staining and merged images of cells are shown. Bars, 3 mm. (B) HeLa cells were treated with α-amanitin after EGFP-PRPF40B expression. Then, the samples were processed for immunofluorescence analysis. Individual staining of PRPF40B (green), SRSF2 (red), and merged images of untreated (upper panel) or treated (lower panel) cells are shown. Line scans showing the local intensity distribution of PRPF40B in green and SRSF2 in red are shown to the right of the panels. Bars in the merged panels indicate the position of the line scans. Bars, 3 mm.




