


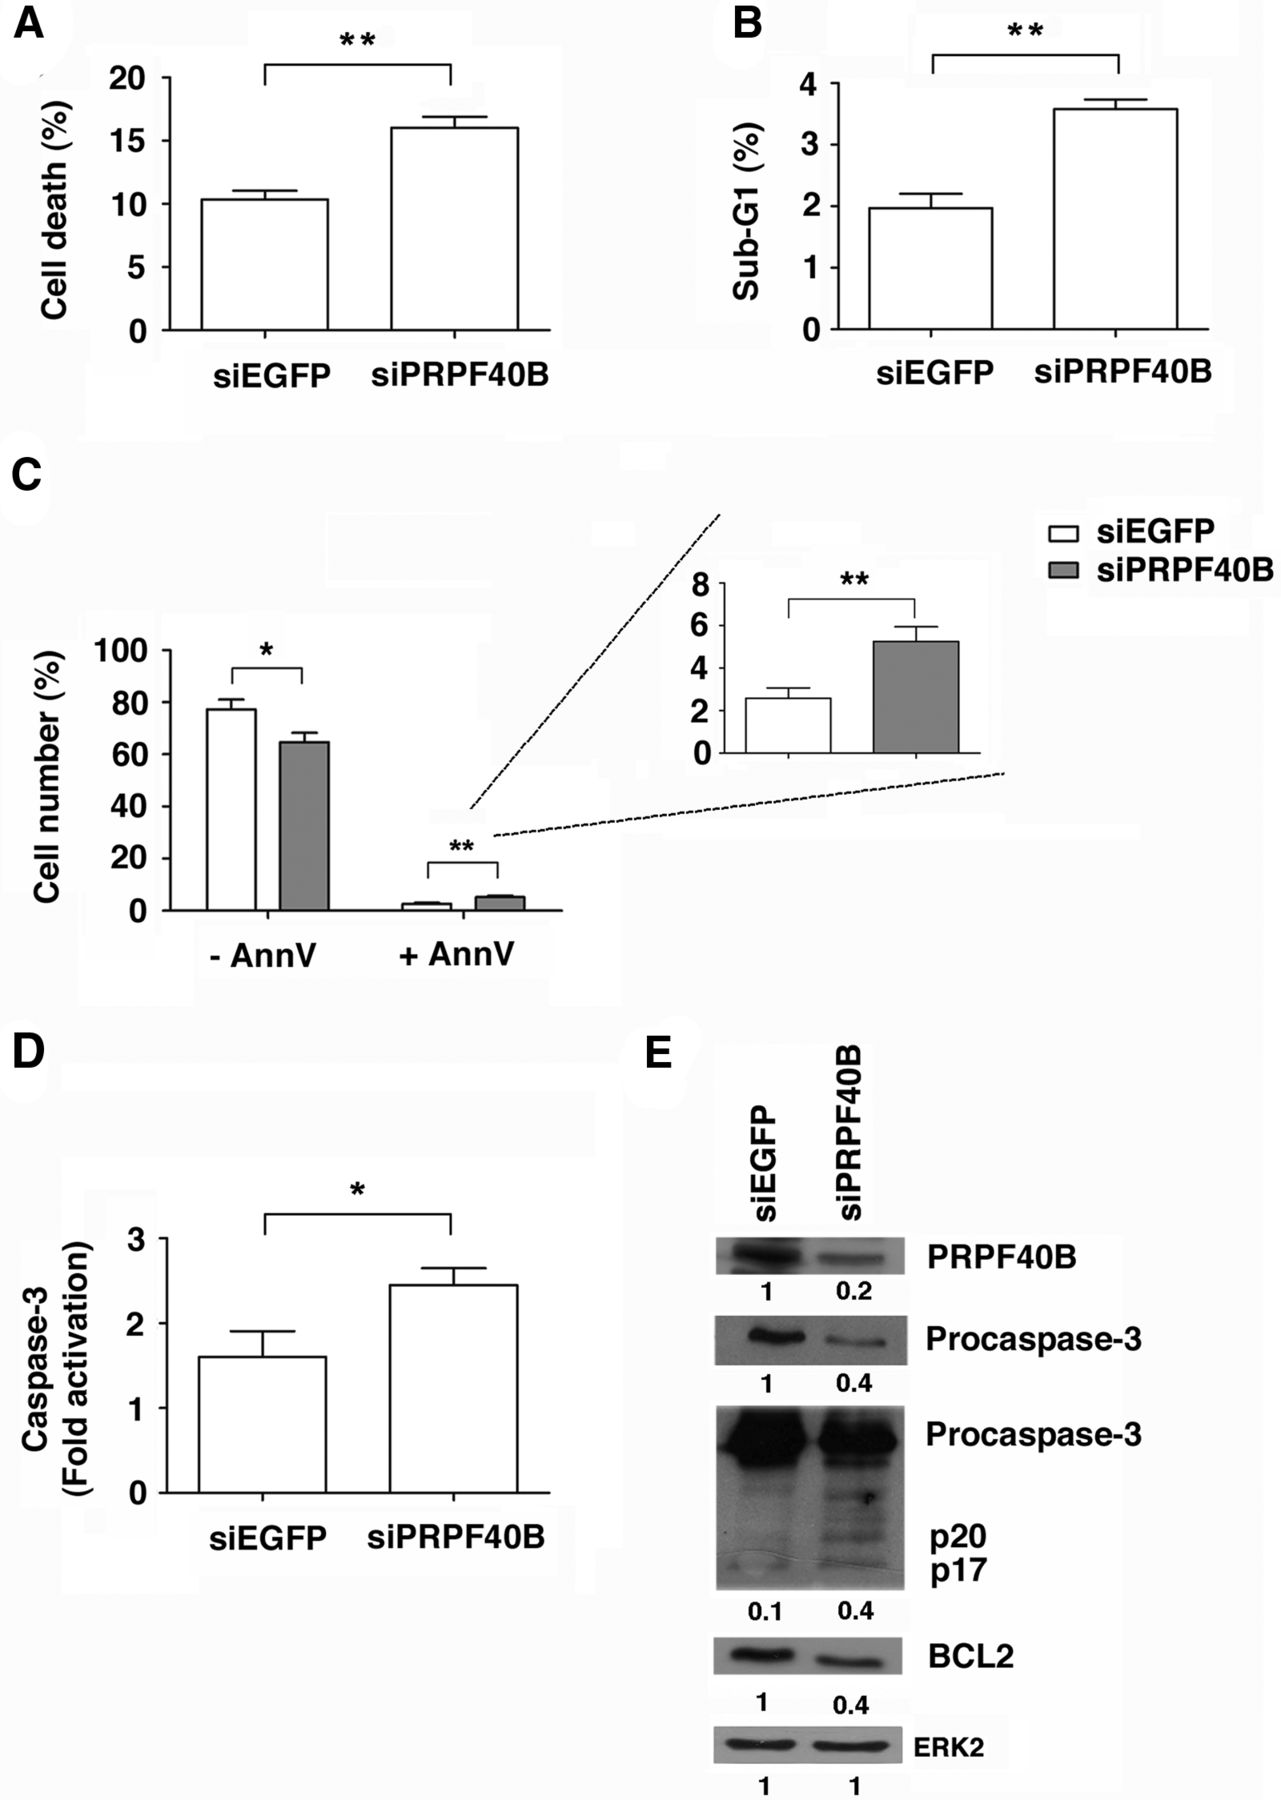
Effect of PRPF40B depletion on apoptosis. HEK293T cells were transiently transfected with siEGFP (control) or siPRPF40B. (A) Flow cytometry analysis of HEK293T cells stained with PI for 30 min at 37°C. The bar graphs show the data from three independent experiments (means ± SEM). (**) P < 0.01. (B) PRPF40B depletion increases the percentage of the sub-G1 cell population. The cells were fixed prior to RNase treatment and PI staining. The cell cycle phases were determined by flow cytometry. The graph shows the percentage of cells in the sub-G1 phase of the cell cycle. The data are from three independent experiments (means ± SEM). (**) P < 0.01. (C) PRPF40B knockdown increases annexin-V binding. Control and PRPF40B-knockdown HEK293T cells were incubated without or with annexin-V and analyzed by flow cytometry. The bar graphs show the percentage of cells from three independent experiments (means ± SEM). (*) P < 0.05; (**) P < 0.01. (D) Analysis of caspase-3 activation in PRPF40B-depleted cells. Activation of caspase-3 was significantly increased in PRPF40B-knockdown HEK293T cells. Caspase-3 activation was measured by chemiluminescence in control and PRPF40B-depleted cells. The bar graph shows the fold activation from three independent experiments (means ± SEM). (*) P < 0.05. (E) Analysis of PRPF40B, procaspase-3 cleavage (precursor p35 and cleaved fragments p20/p17), and BCL2 levels. Protein expression was analyzed by immunoblotting using specific antibodies in protein extracts obtained from control and PRPF40-depleted cells. ERK2 was used as a loading control. The p20 + p17/procaspase-3 ratio was calculated to determine the values of the caspase isoforms. The quantification of the bands is shown below each panel.




