


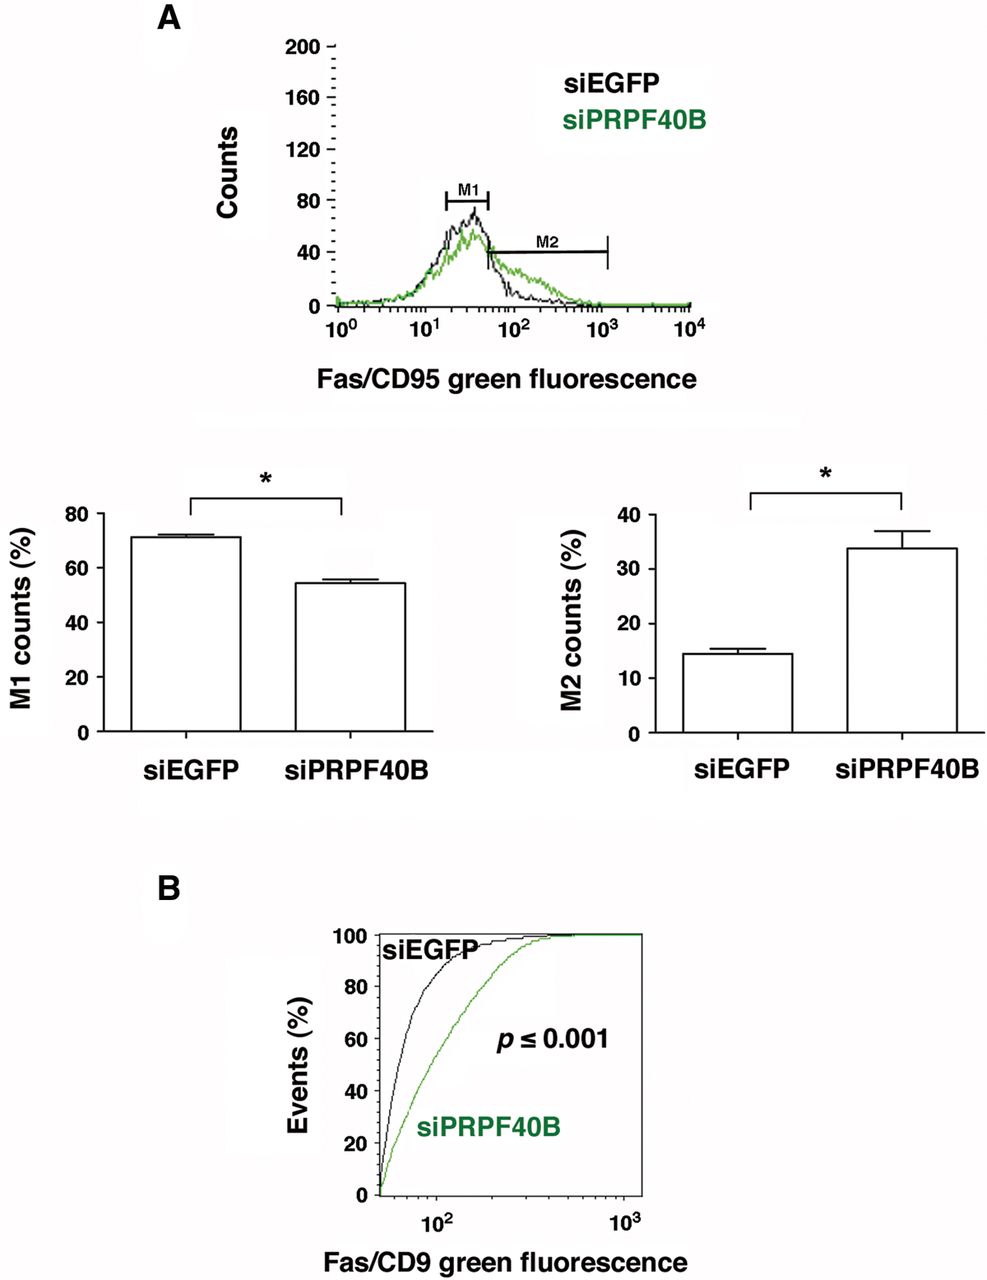
Analysis of the number of Fas receptors on the plasma membrane of control and PRPF40B-depleted cells by flow cytometry. (A) The top panel shows the flow cytometry-generated frequency histogram of Fas/CD95-associated fluorescence in control (siEGFP, black) and siPRPF40B (green) cells. The results shown are representative of three repeat experiments. The bottom panels show the quantification analysis of the Fas/CD95-specific fluorescence in the M1 (left) and M2 (right) populations. The graphs show the data from three independent experiments (means ± SEM). (*) P < 0.05. (B) The graph represents Kolmogorov–Smirnov statistics obtained from comparing the population distributions of the Fas/CD95-associated fluorescence in siEGFP (black) and siPRPF40B (green) cells. The P value was ≤0.001, which indicates that the two groups were sampled from populations with different distributions.




