


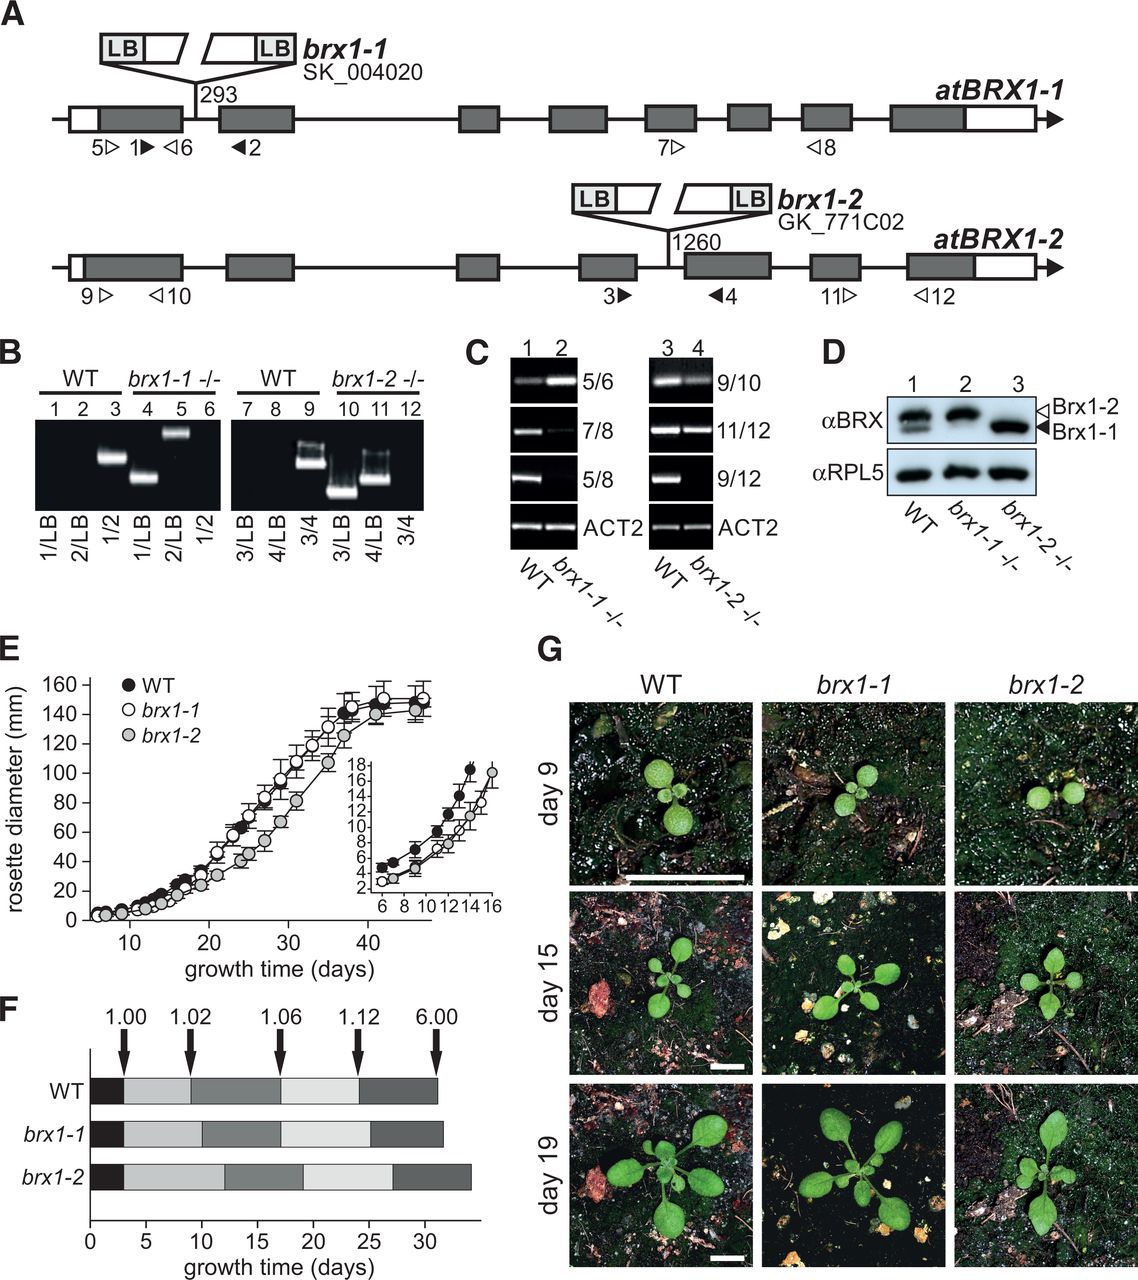
Characterization of brx1 mutant plants. (A) The gene model of BRX1-1 and BRX1-2 with the T-DNA position of the mutants is shown. The positions of the oligonucleotides used in B (filled triangle) and C (open triangle) are indicated below. (B) The segregation of the T-DNA insertion in the indicated mutants (lanes 4–6 and 10–12) was analyzed by PCR on genomic DNA (gDNA) with the oligonucleotides shown in A. LB: T-DNA left border primer. Wild-type (WT) gDNA was analyzed as control (lanes 1–3 and 7–9). (C) The presence of BRX1 mRNA was analyzed by RT-PCR using RNA isolated from wild type (lanes 1,3), brx1-1 (lane 2), and brx1-2 (lane 4) and the oligonucleotides shown in A. Actin (ACT2) mRNA was amplified as loading control. (D) The presence of the atBRX1 protein was determined by Western blotting using the atBRX1 antibody on protein extracts from wild type (WT, lane 1), brx1-1 (lane 2) and brx1-2 (lane 3). atRPL5 served as loading control (αRPL5). (E) The rosette diameter was determined for at least 10 independent, randomly selected, plants of each genotype as indicated. Inset shows the growth curve between days 4 and 16. The standard deviation is shown. (F) Developmental stages according to Boyes et al. (2001). (G) Pictures of the plant lines indicated on top were taken on days 9, 15, and 19. Scale bar: 10 mm.




