


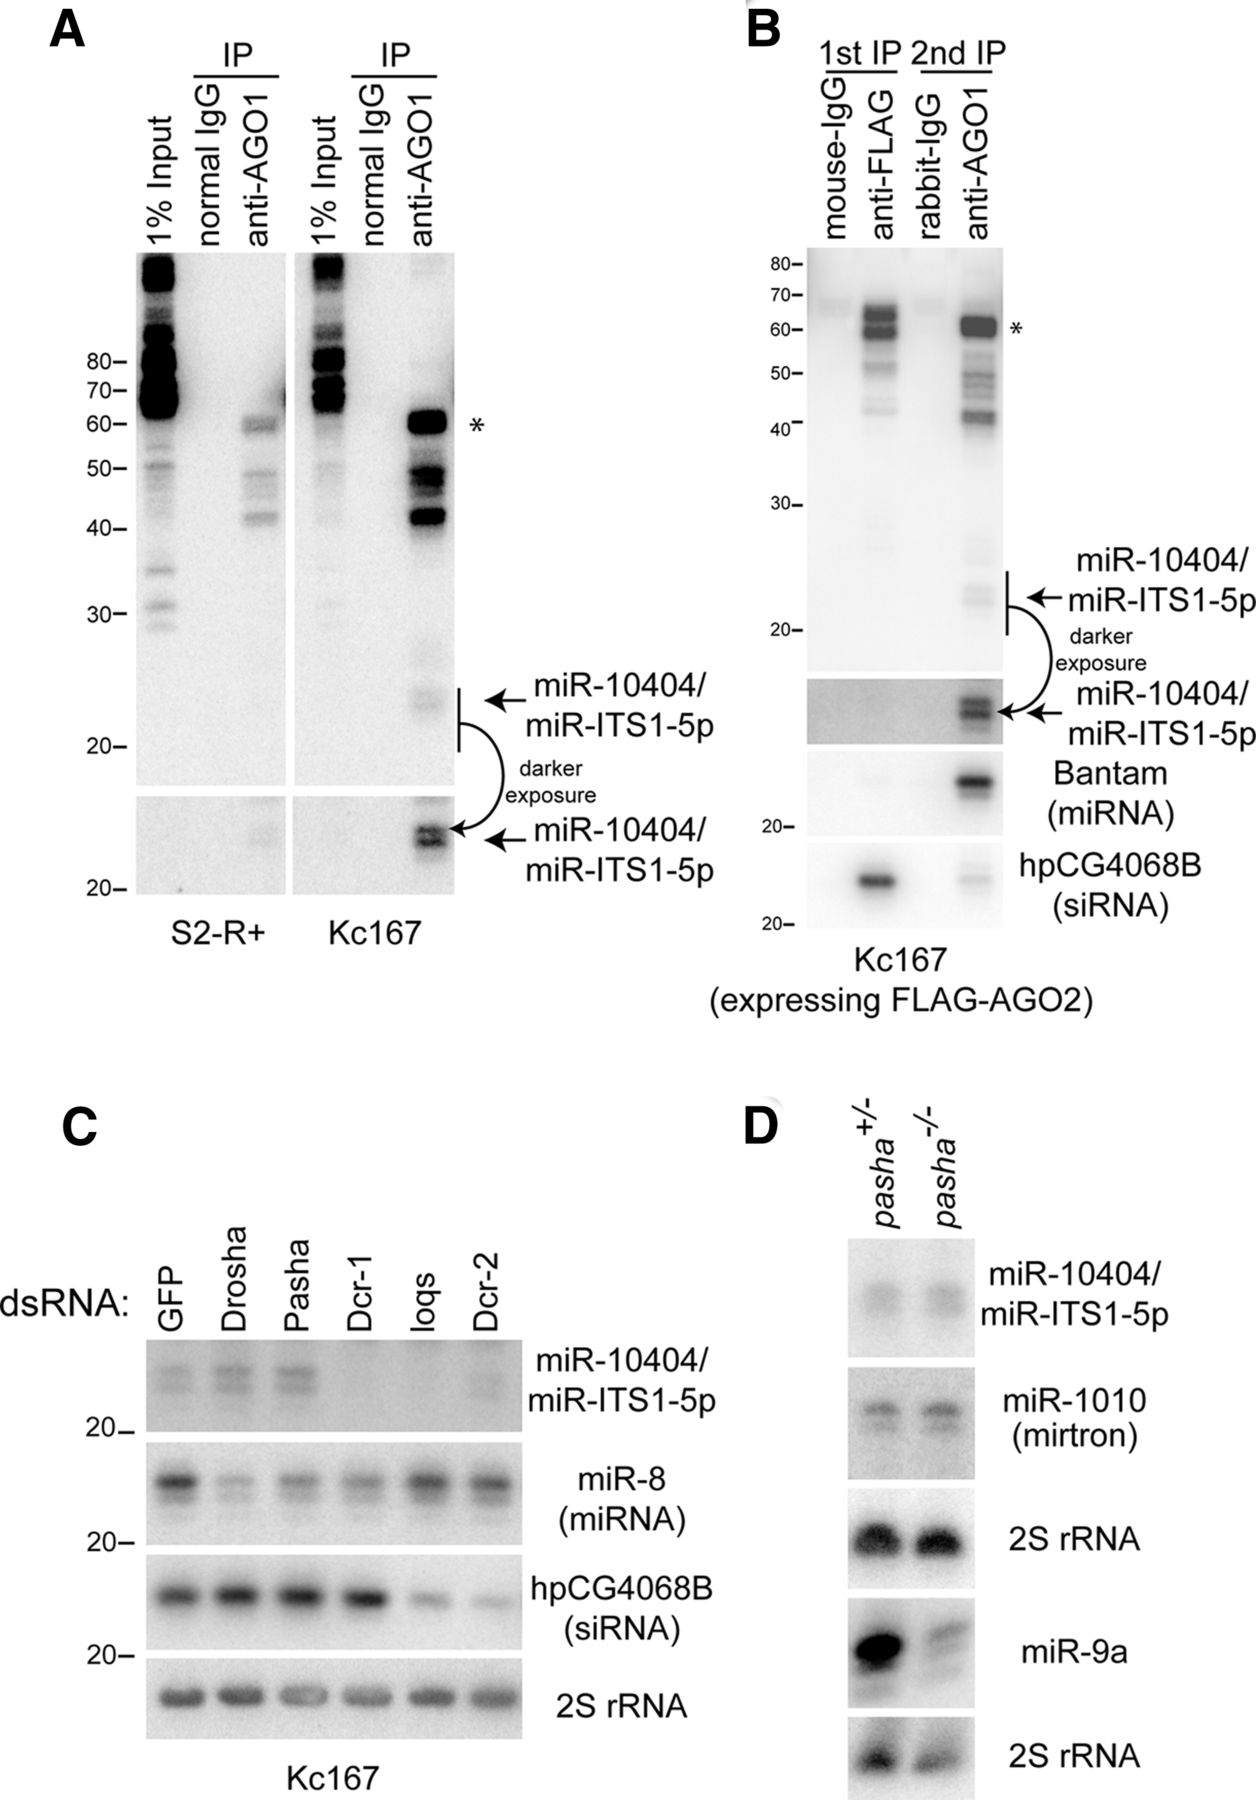
Expression and sorting of ITS1 miRNA. (A) Loading of miR-10404/miR-ITS1-5p to AGO1 in S2-R+ cells and Kc167 cells. AGO1-complexes were purified from S2-R+ (left panels) or Kc167 cells (right panels). RNA extracted from ∼1% lysate was used for input analysis. The mature species (∼22 nt, arrow) and the presumable precursor hairpin (60 nt, asterisk) were enriched in the AGO1 complex. (B) Sorting of miR-10404/miR-ITS1-5p to AGO1 in Kc167 cells. FLAG-AGO2 and AGO1 complexes were sequentially purified from Kc167 cells stably expressing FLAG-tagged AGO2 protein. miR-10404/miR-ITS1-5p is enriched in AGO1. Successful IP was verified by probing the same membrane for Bantam miRNA and hp-CG4068B siRNA, which are enriched in the AGO1 and FLAG-AGO2 complexes, respectively. The arrow and the asterisk indicate the mature and hairpin species. (C) Processing of mir-10404/mir-ITS1. RNA samples were prepared from Kc167 cells soaked with indicated dsRNAs. miR-10404/miR-ITS1 production was reduced when Dcr-1 or Loqs was depleted. On the other hand, Drosha knockdown did not reduce expression of miR-10404/miR-ITS1. A canonical miRNA miR-8 is slightly (∼50%) reduced in Drosha knockdown cells. Four micrograms of small RNA-enriched RNA was loaded in each lane. Quantified signal intensities are shown in Supplemental Figure S5A. (D) Production of miR-10404/miR-ITS1 in pasha mutant. RNA was extracted from heterozygous or homozygous pasha mutant third instar larvae. miR-10404/miR-ITS1 expression did not change in pasha mutant. A canonical miRNA (miR-9a), but not a mirtron (miR-1010), was reduced in pasha mutant. 2S rRNA panels are shown as loading control for the miR-10404/miR-ITS1 and miR-1010 panels (middle 2S panel) or for the miR-9a panel (bottom 2S panel). For the three panels from the top (miR-10404/miR-ITS1-5p, miR-1010, and 2S rRNA), 4 µg small RNA-enriched RNA was loaded. For other panels, 20 µg total RNA was loaded in each lane. Signal quantification results are shown in Supplemental Figure S5B.




