


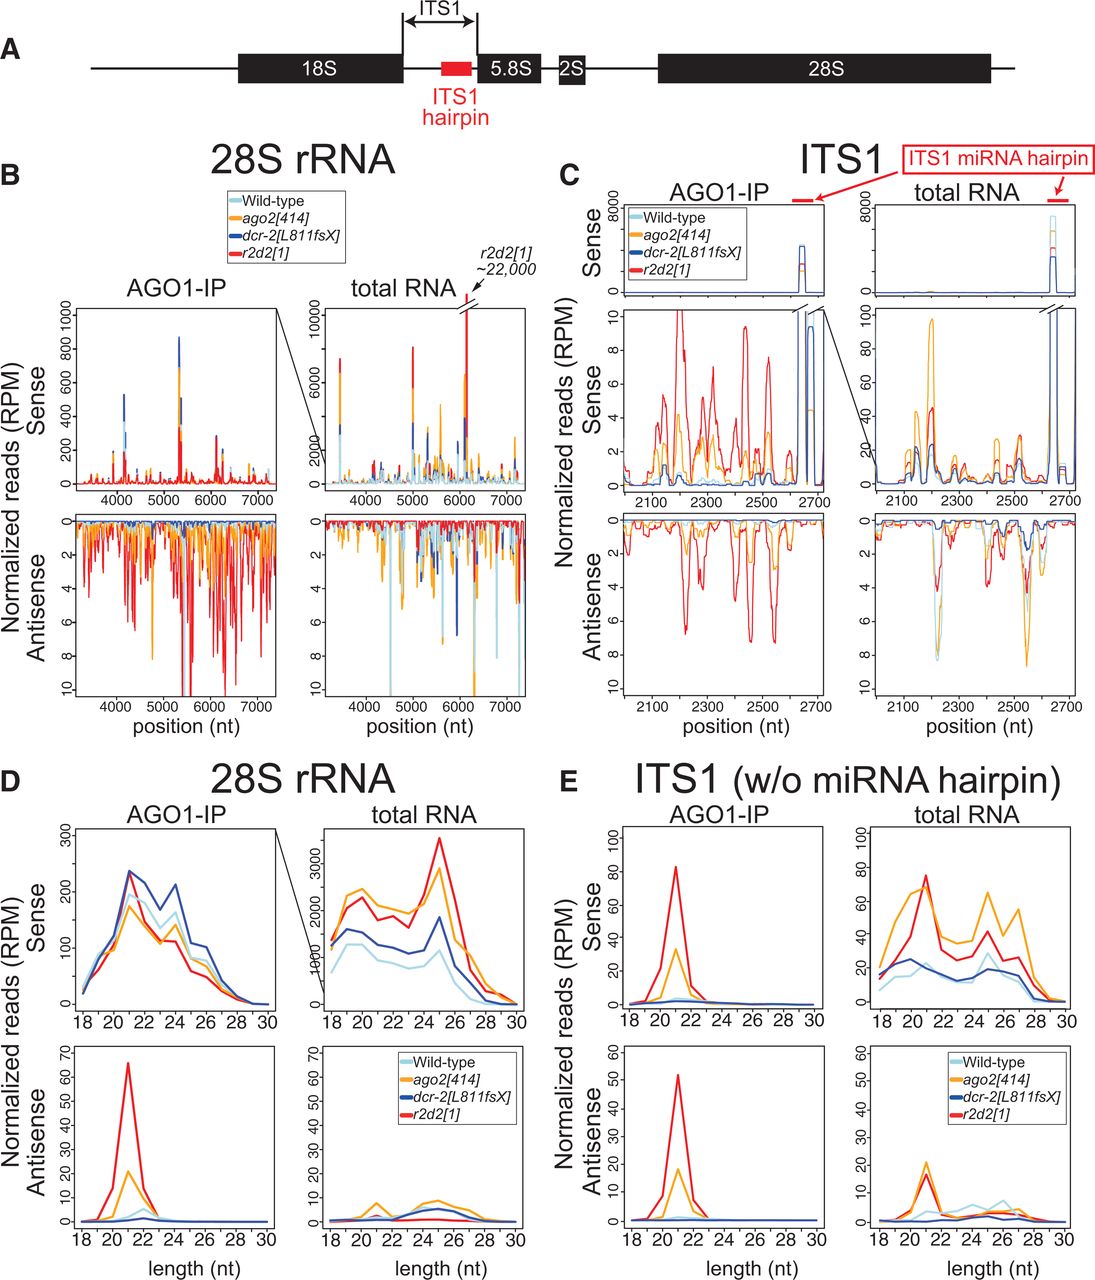
siRNAs produced from the rDNA locus. (A) Schematic representation of the Drosophila rDNA gene structure. (B,C) Small RNA read densities on the sense (upper panels) and antisense (bottom panels) strands of 28S rRNA (B) and ITS1 (C) regions were plotted. Read counts were normalized by the number of reads mapping to miRNA hairpins. The x-axis shows the nucleotide position on the D. melanogaster rDNA sequence (NCBI M21017.1). Upper panels in C are the same plots as the middle panels with broader y-axis ranges to accommodate the high ITS1 miRNA peaks. (D,E) Size distribution of small RNA reads mapping on the sense (upper panels) and antisense (bottom panels) strands of 28S rRNA (D) and ITS1 (E) regions. In order to compare the different region sizes, values were further normalized to RPM per kilobase region mapped. To obtain the size distribution of ITS1 mapping reads, we removed the mir-10404/mir-ITS1 hairpin sequence that produces a large number of miRNA reads. Results for other regions are shown in Supplemental Figure S1.




