


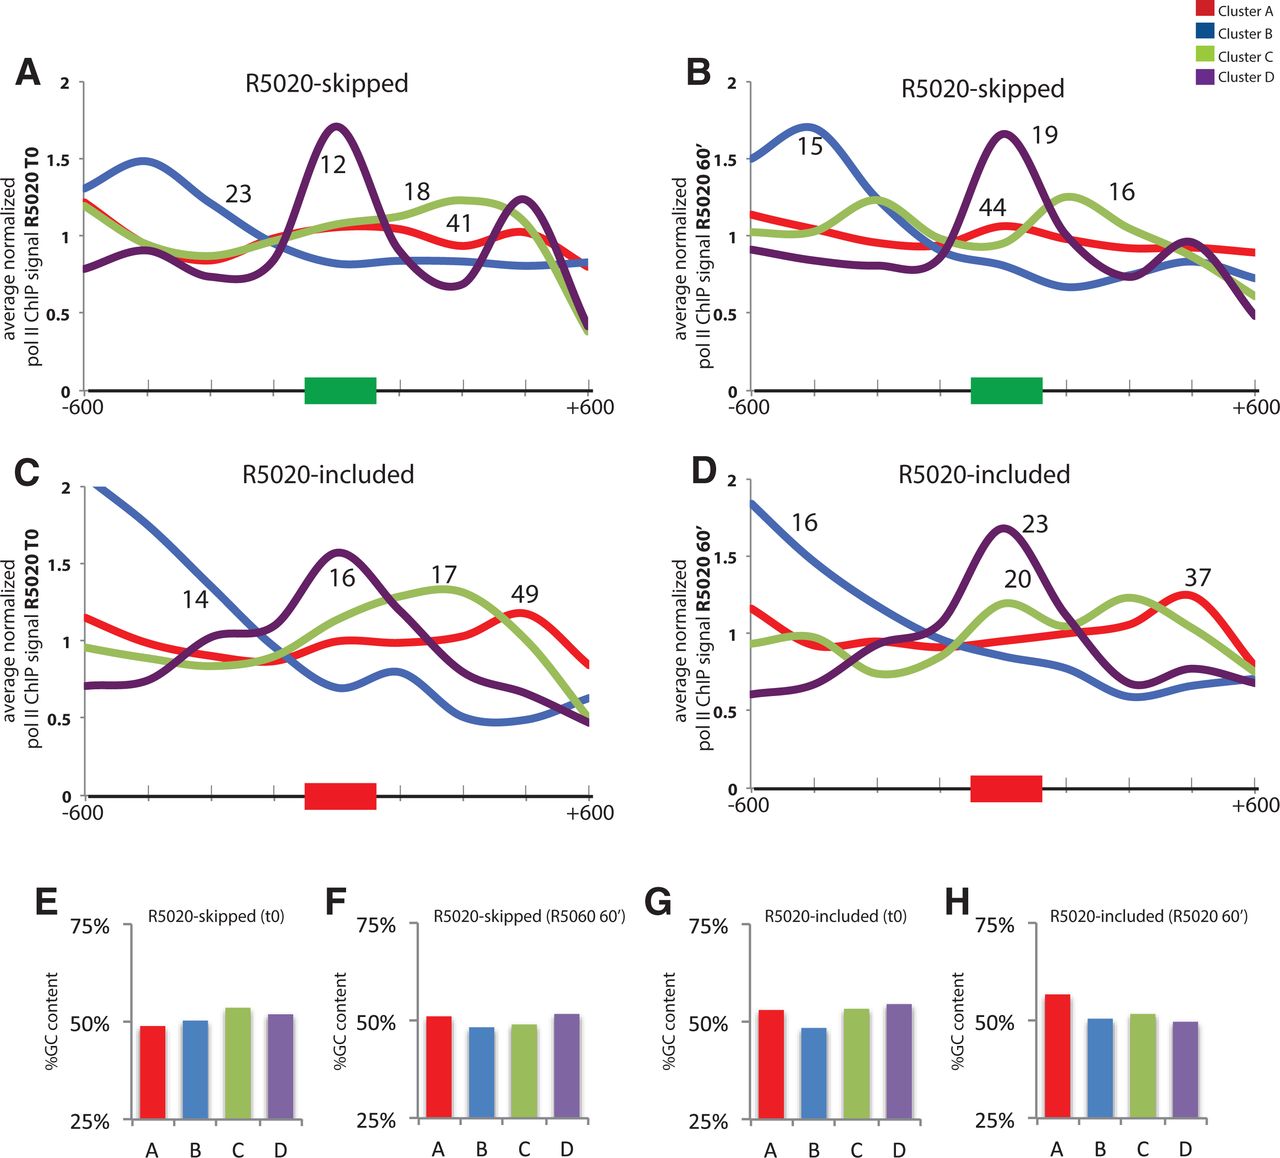
FIGURE 6.
Distribution of RNA polymerase II in regulated exons and flanking introns. Average normalized RNA polymerase II ChIP-seq reads are represented relative to the alternative exons and flanking introns in each nucleosome profiling class (color code as given in previous figures), for R5020-skipped (A,B) or R5020-included exons (C,D), 60 min after mock (A,C) or (B,D) hormone treatment. (E–H) Average percentage of GC content of exon clusters in each of the categories represented in A–D.




