


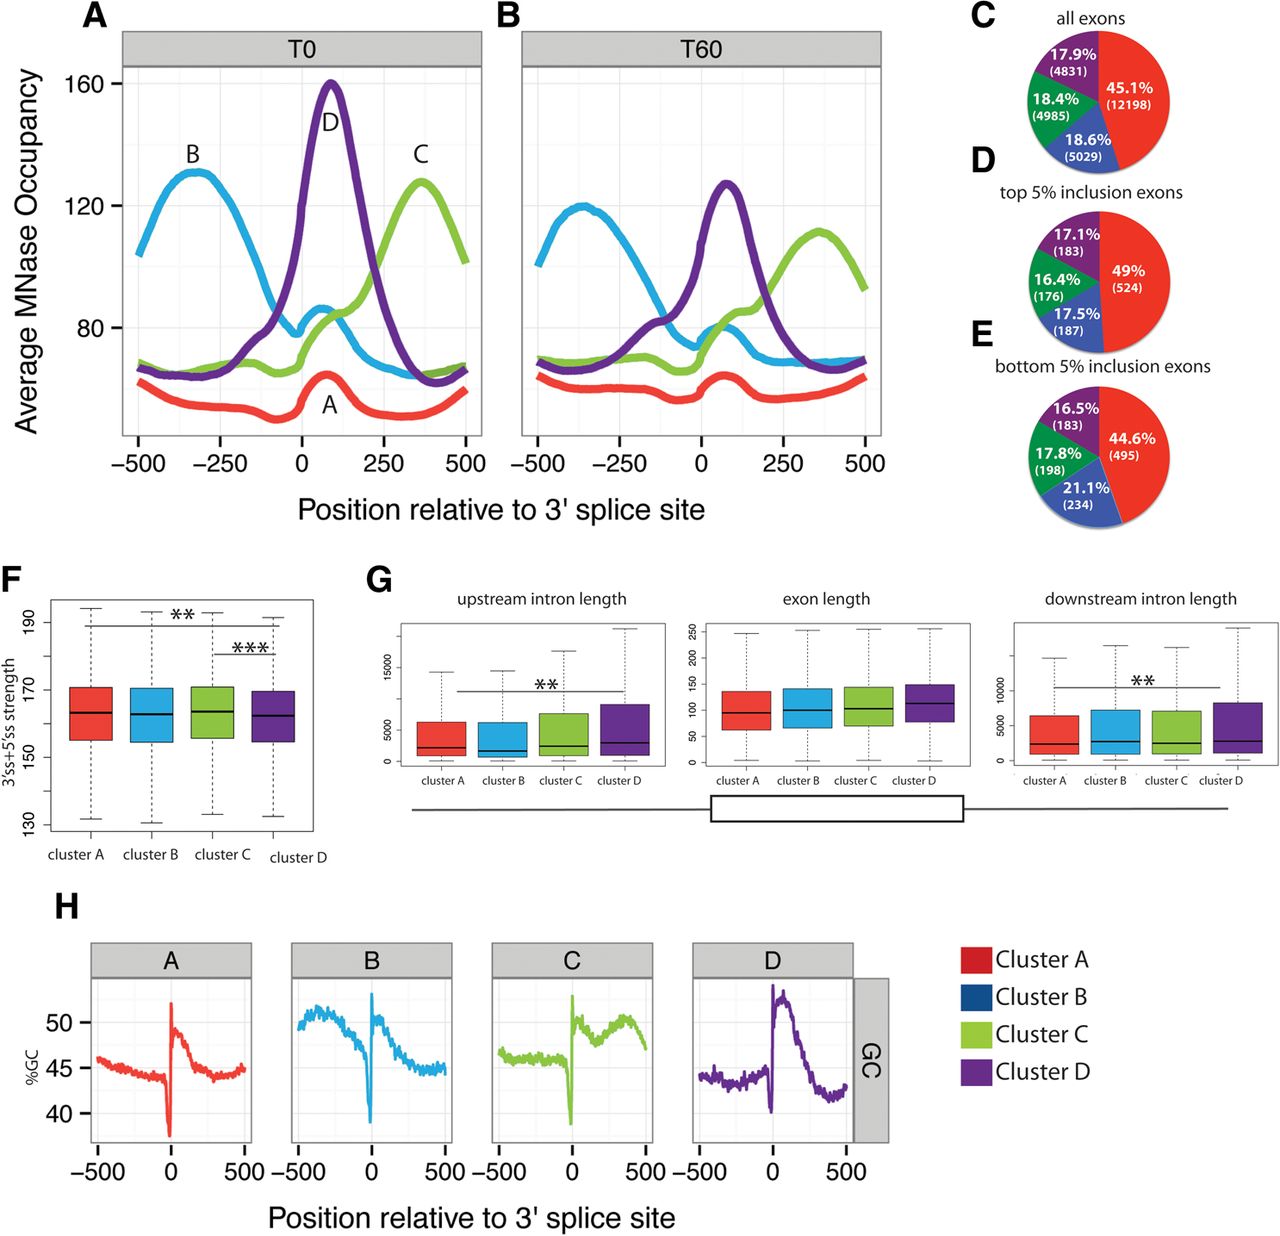
Clusters of nucleosome profiles around alternatively spliced exons. (A,B) Four classes of nucleosome profiles identified using K-means in T47D cells before (A) and 60 min after (B) progesterone stimulation. Profiles of MNase reads relative to the position of 3′ splice sites (0) are represented as in Figure 2 for four distinct clusters of exons before (T0) (A) and after progesterone treatment (T60) (B). (C–E) Distribution of exons in the four classes of nucleosome profile clusters for all exons (C), exons in the top 5% of exon inclusion range (D), or exons in the bottom 5% of exon inclusion range (E). The colors correspond to each of the clusters defined in panels A–B. Figures between brackets indicate the number of exons in each category. (F) Distribution of splice site strengths associated with exons in the four classes of nucleosome profiles. Combined strength of 5′ and 3′ splice sites was measured by Analyze Splice Tool (http://ibis.tau.ac.il/ssat/SpliceSiteFrame.htm). Colors correspond to the clusters defined in A,B. P-values are represented by (*) 0.05 > P > 0.01, (**) 0.01 > P > 0.001, (***) 0.001 > P in the difference between splice site strengths between the indicated clusters, according to two sample t-test. (G) Distribution of alternative exon and flanking intron lengths for the four clusters of nucleosome profiles defined in A,B. P-values are represented by (**) 0.01 > P > 0.001, (***) 0.001 > P in the difference between lengths between the indicated clusters, according to two sample t-test. (H) Distribution of GC content (in percentage) relative to the 3′ splice site of alternative exons in the four classes of nucleosome profiles defined in A,B. Colors correspond to the clusters defined in A,B.




