


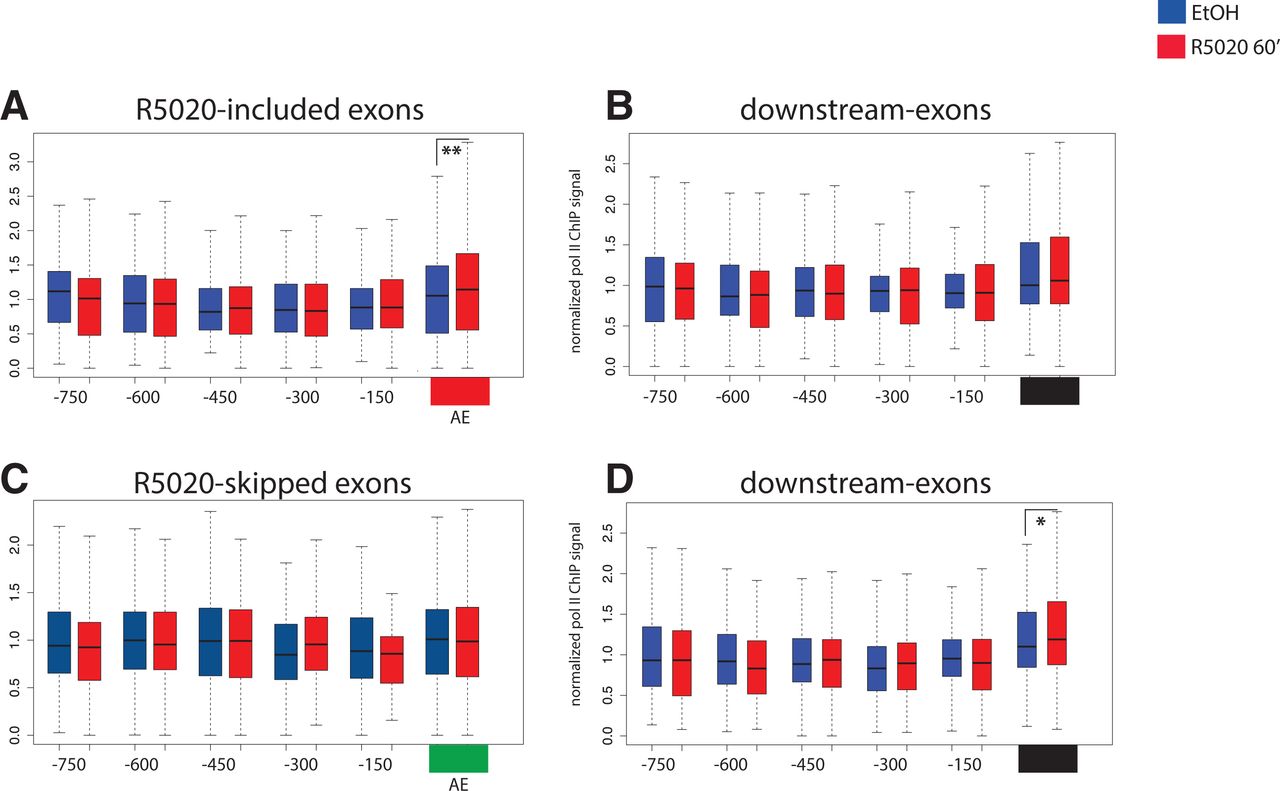
FIGURE 3.
Distribution of RNA polymerase II in exons and upstream intronic regions. Boxplots represent the density of deep sequencing reads of DNA molecules associated with RNA polymerase II ChIP experiments, corresponding to alternative exons and 750 nt upstream, normalized to local average, mock-treated with ethanol (blue) or with R5020 for 60 min (red). Density maps correspond to R5020-included or R5020-skipped exons (A and C, respectively), their constitutive downstream exon (B,D). P-values calculated by paired two-sample t-test are indicated by (*) 0.05 > P > 0.01, (**) 0.01 > P > 0.001.




