


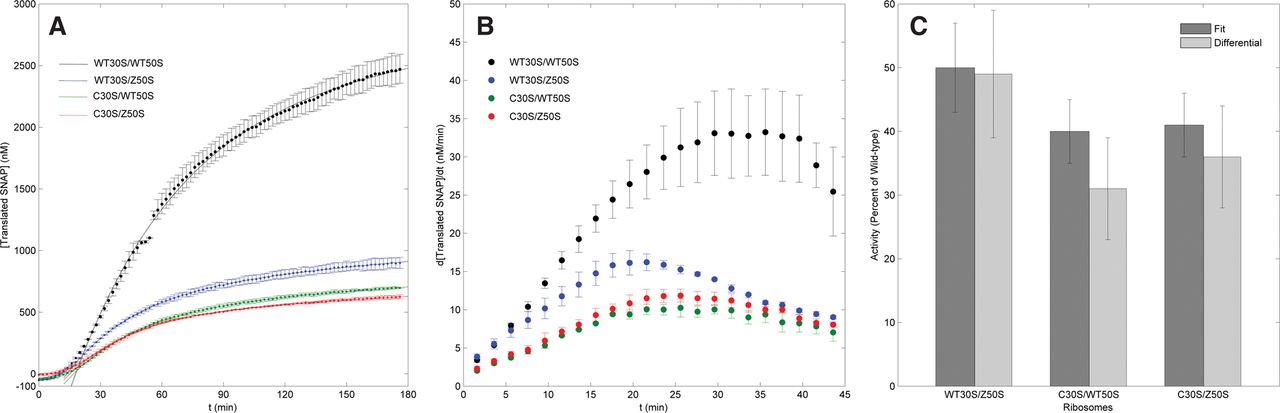
FIGURE 5.
(A) SNAPf synthesis curve for wild-type and mutant ribosomes. SNAPf concentrations are data points with error bars, and the first-order kinetic fits are solid lines. Reaction conditions same as Figure 3A. (B) Differential analysis for SNAPf synthesis data. (C) Comparison of wild-type and mutant activities calculated from the first-order kinetics model and differential analysis.




