


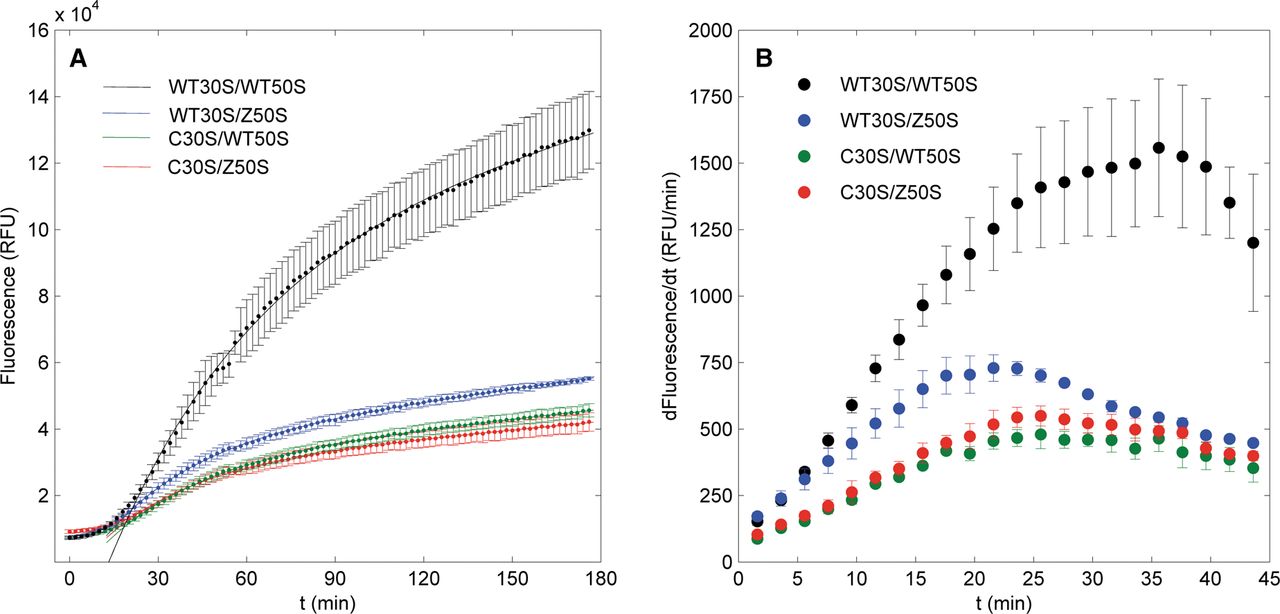
FIGURE 3.
(A) Fluorescence curves of in vitro SNAPf translation by wild-type and mutant ribosomes. Points with error bars are fluorescence data, and solid lines are fits to the first-order kinetics model. All fits were validated by bootstrap analyses. Reaction conditions: 500 nM ribosomes, 2 μM mRNA, and 10 μM CBG-488-TQ2. (B) Differentials of fluorescence curves.




