


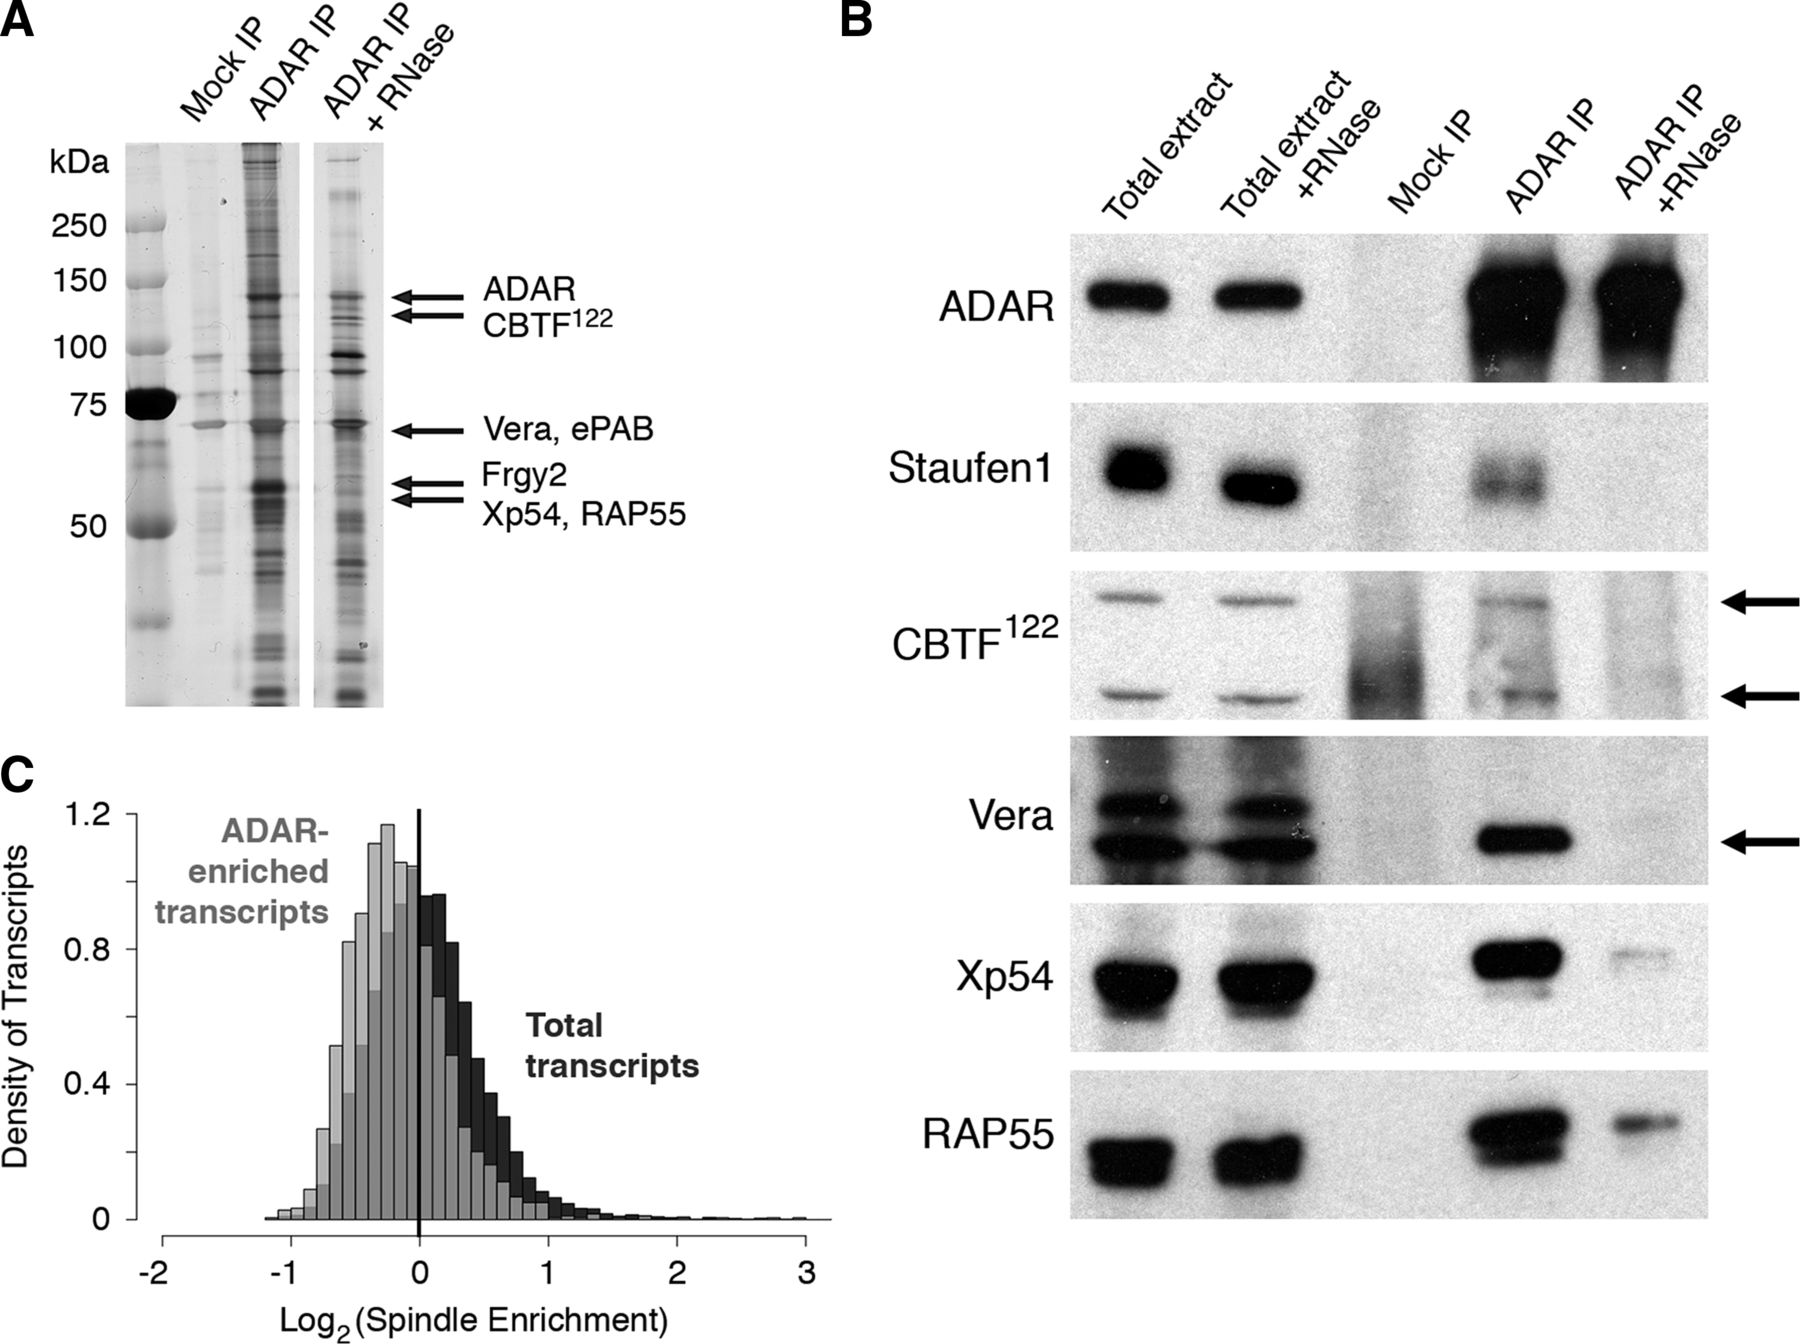
Characterization of endogenous ADAR-RNPs. (A) SDS-PAGE of proteins that coimmunoprecipitate with ADAR from egg extract or egg extract treated with RNaseA. The precipitations were washed with buffer containing 1% Triton prior to elution with SDS. The most abundant components of bands analyzed by mass spectrometry are indicated with labeled arrows. (B) Western blots for candidate proteins in total egg extract or ADAR-precipitations with or without RNase treatment. (C) Histogram of transcript density as a function of spindle-enrichment. Dark gray histogram represents all transcripts. Light gray histogram represents transcripts with ADAR-enrichment values ≥4. P-value for the difference in the distributions is <3 × 10⁻¹⁶ using a two-sided Mann–Whitney test with continuity correction.




