


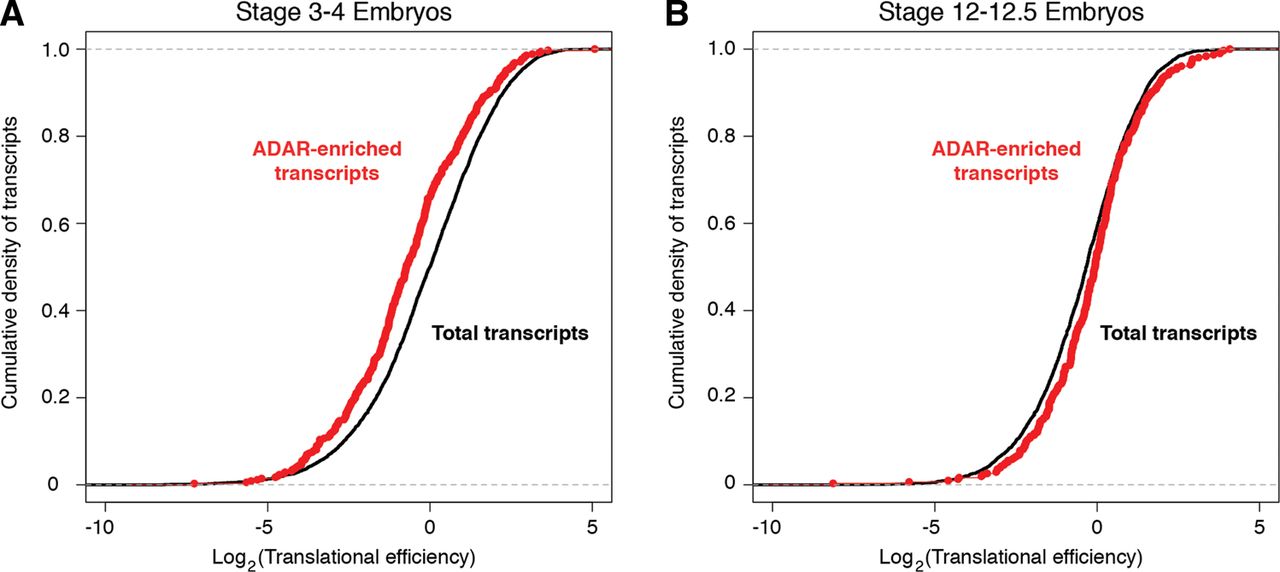
FIGURE 5.
Translational efficiency of ADAR-associated transcripts. (A) Plot of the cumulative density of transcripts as a function of translational efficiency in stage 3–4 X. laevis embryos. Translational efficiency values are based on published data (Subtelny et al. 2014). Black line represents all abundant transcripts for which translational efficiency data were available (∼4500 transcripts). Red line represents the subset of those transcripts with ADAR-enrichment values ≥4. (B) Same as A, but for stage 12–12.5 embryos.




