


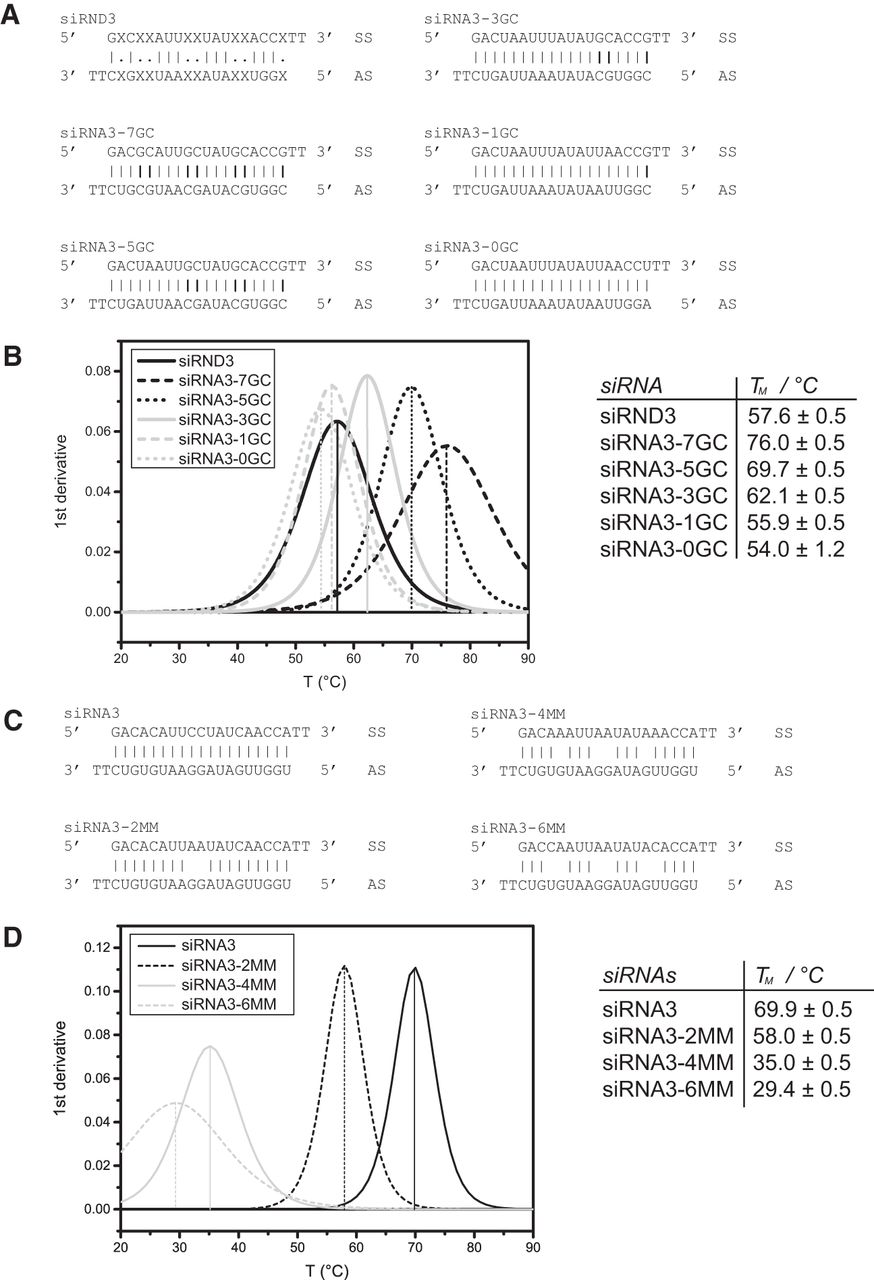
Properties of nonrandomized siRNAs. (A) Sequences of siRND3 and nonrandomized siRNA3 control duplexes differing in the number of G–C base pairs present (0–7). The sequences of the siRNAs were based on siRND3 and mismatches introduced at the positions where randomizations occurred in siRND3. Watson–Crick base pairs are indicated with a dash. (B) Melting curve analysis of nonrandomized siRNA3 controls. The graph shows the first derivative of melting curves. TMs listed in the table represent the mean of triplicate measurements ± SD. (C) Sequences of the nonrandomized mismatch control siRNA duplexes. The sequences of the siRNAs were based on siRND3 and mismatches introduced at the positions where randomizations occurred in siRND3. Watson–Crick base pairs are indicated with a dash. (D) Melting curve analysis of mismatch controls. The graph shows melting temperatures of nonrandomized siRNA duplexes that carry a defined number of mismatched base pairs. TMs listed in the table represent the mean of triplicate measurements ± SD.




