


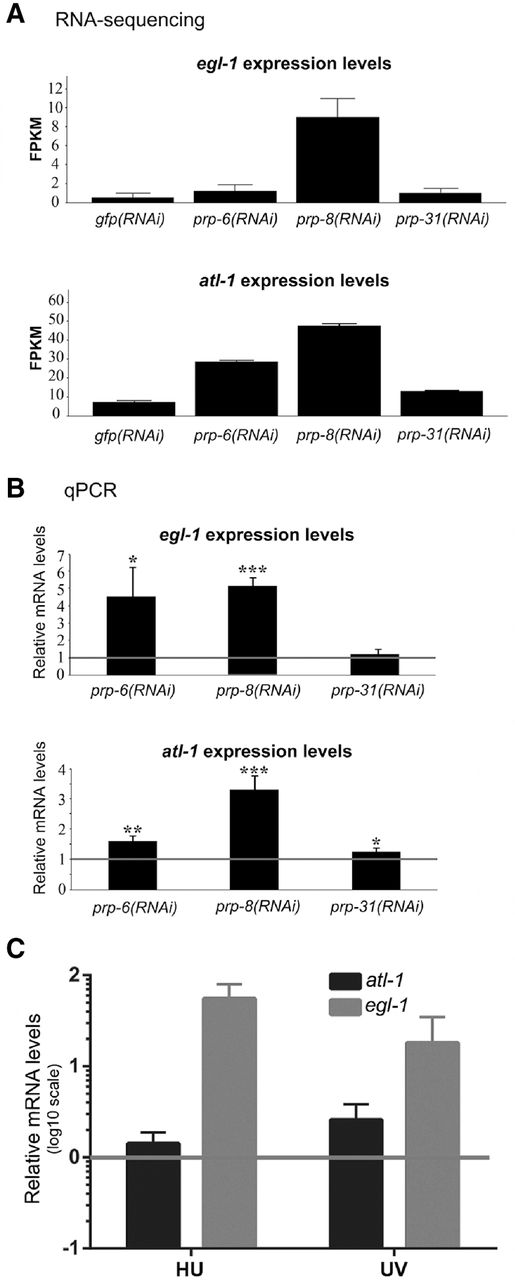
Up-regulation of atl-1 and egl-1 after RNAi of s-adRP genes follows a gradient from prp-8(RNAi) to prp-31(RNAi). (A) RNA-seq data of atl-1 and egl-1 after RNAi in wild-type worms. FPKM represents the fragments per kilobase of transcript per million mapped reads. Bars indicate the average “confidence_high” and “confidence_low” values provided by Cufflinks (Trapnell et al. 2012) for each gene. (B) Validation of the RNA-seq data by qPCR. mRNA levels of atl-1 and egl-1 upon RNAi of some s-adRP genes are represented relative to their expression in gfp(RNAi) control animals (arbitrary value of 1, indicated with a gray line). qPCR expression data were normalized to transcript levels of tbb-2. Three separate experiments were analyzed. Error bars represent the standard deviation. Student's t-test for independent samples was used to analyze the statistical significance: One, two, and three asterisks indicate P < 0.05, P < 0.01, and P < 0.001, respectively. (C) Both DNA insults, UV and hydroxyurea, produce an increase in atl-1 and egl-1 expression. Quantification of expression levels of atl-1 and egl-1 in wild-type animals treated either with UV (100 J/m2) or hydroxyurea (25 mM). Expression levels of these genes are represented relative to the ones in untreated worms.




