


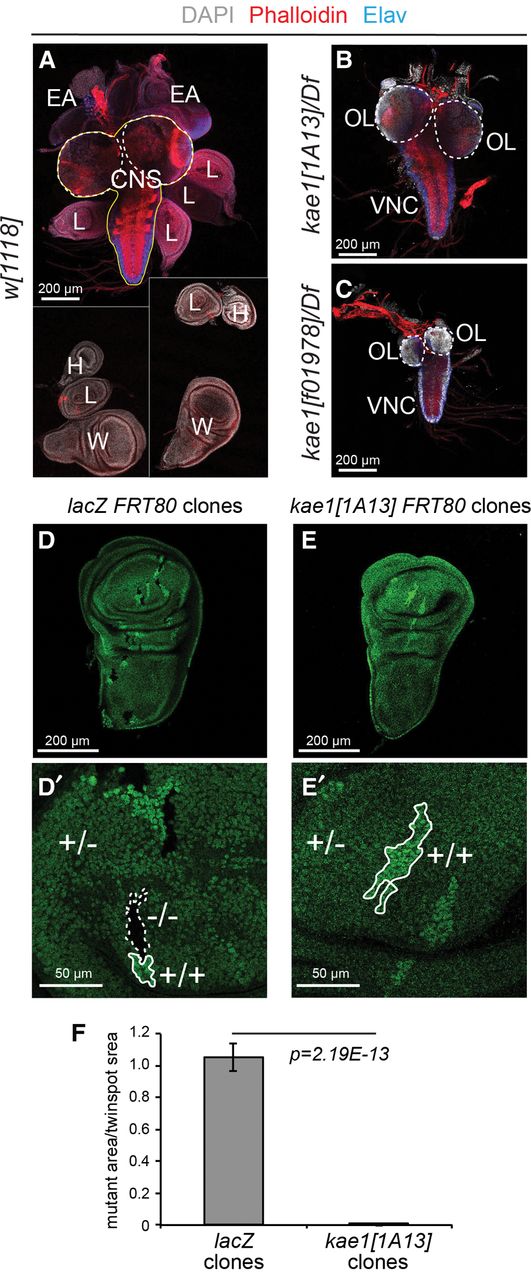
Essential requirement for kae1 in imaginal disc cells. (A–C) Preparations of third instar brain-disc complexes, stained for DAPI (gray), phalloidin (red) and the post-mitotic neuronal marker Elav (blue). Scale bars, 200 μm. (A) Wt complexes show the CNS (in outline) and an array of discs that generate the adult body structures. Because not all the discs remain attached to each other during dissection, a composite image that captures all of the discs is shown. These include pairs of wing (W), haltere (H), and eye-antennal (EA) discs, and six leg (L) discs. In kae1[1A13] (B) and kae1[f01978] (C) hemizygotes, essentially no imaginal discs are found, even though the CNS can be readily identified. The CNS can be divided into the optic lobes (OL, dotted lines) and the ventral nerve cord (VNC). The CNS is mildly smaller in kae1[1A13]/Df larvae (B) and substantially reduced in kae1[f01978]/Df larvae (C); however, note that the OL is preferentially reduced. The VNC harbors a stronger proportion of post-mitotic neurons than the OLs, as evidenced by Elav staining. (D,E) Analysis of mitotic clones generated in wing imaginal discs of control lacZ FRT80 (D) and kae1 FRT80 (E) chromosomes; enlargements are shown in D′ and E′. The clones are generated in a heterozygous (+/−) ub-GFP FRT80 background, which produces an intermediate level of GFP. Homozygous mutant clones (−/−) lack GFP whereas their sibling twin-spot clones (+/+) express elevated levels of GFP. Seventy-two hours after clone induction, all three cell populations are identified in the control experiment (D), whereas homozygous kae1 mutant cells were not recovered in wing discs (E). (F) Quantification of relative sizes of clones and their sibling twin-spots. n = 26 lacZ clones and 20 kae1 clones analyzed. Scale bars, 200 μm, except D′, E′, 50 μm.




