


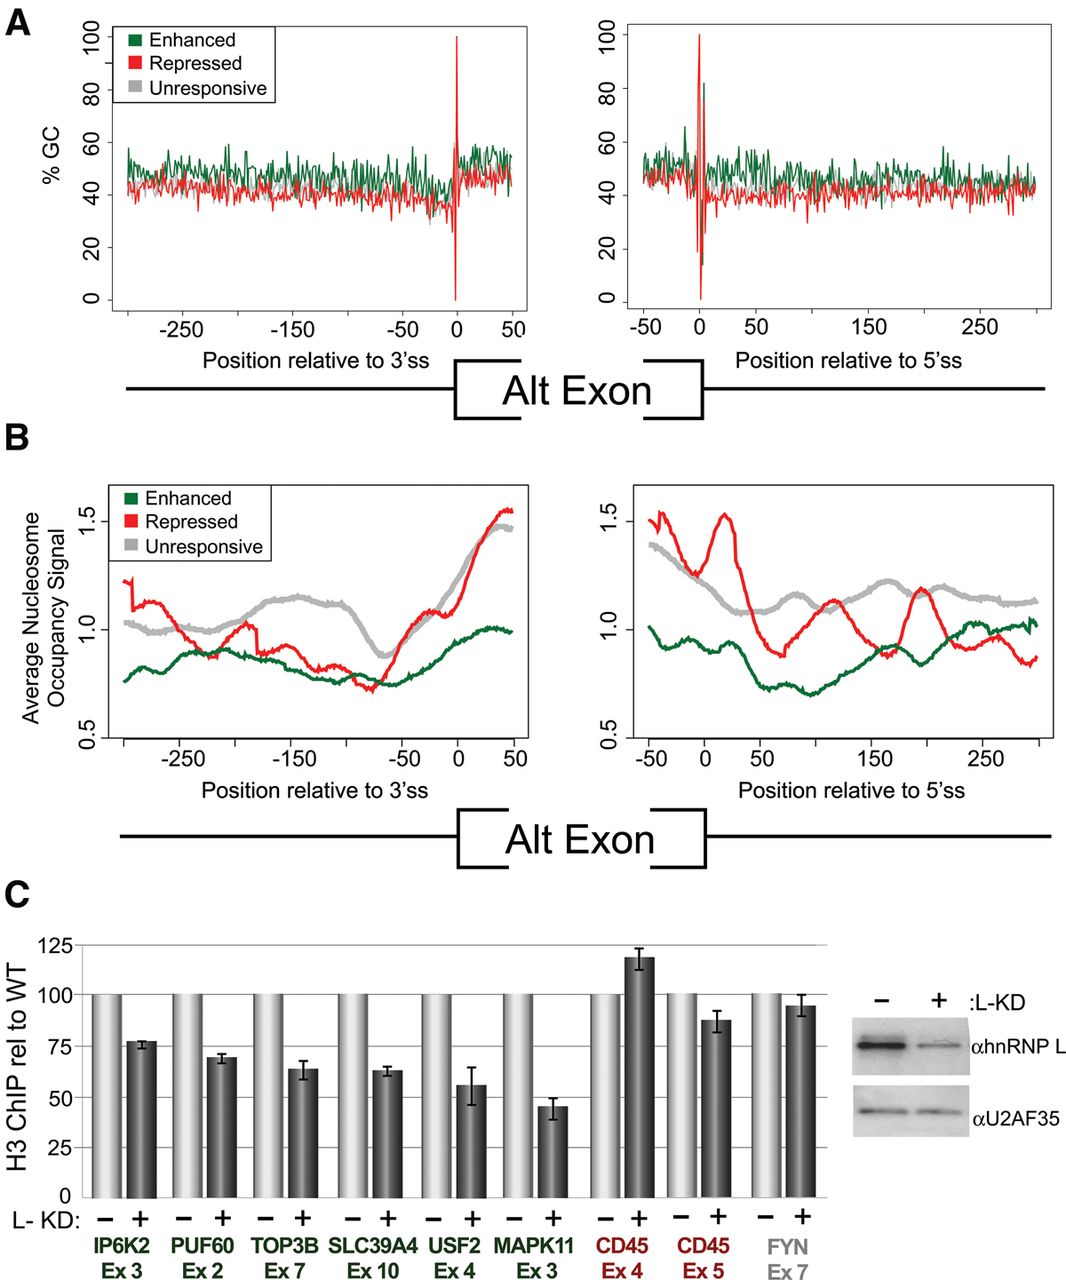
HnRNP L-enhanced exons share epigenetic features that are altered upon hnRNP L depletion. (A) Percentage of GC dinucleotides as a function of distance away from the 3′ss (left) or 5′ss (right) of hnRNP L repressed, enhanced, or unresponsive alternative exons. (B) Similar to A but plotting nucleosome occupancy derived from ENCODE data on K562 cells. (C) Relative qPCR signal of DNA corresponding to indicated hnRNP L-enhanced (green), repressed (red) or unresponsive (gray) exons following ChIP with an antibody that recognizes H3.3 and H3.1. Signal from H3 ChIP in hnRNP L depleted cells (+L-KD) is calculated relative to bead-alone control and then normalized by the H3/bead signal in wild-type Jurkat cells (−L-KD), which is set to 100. On right is a Western blot showing hnRNP L knockdown relative to U2AF35 loading controls.




