


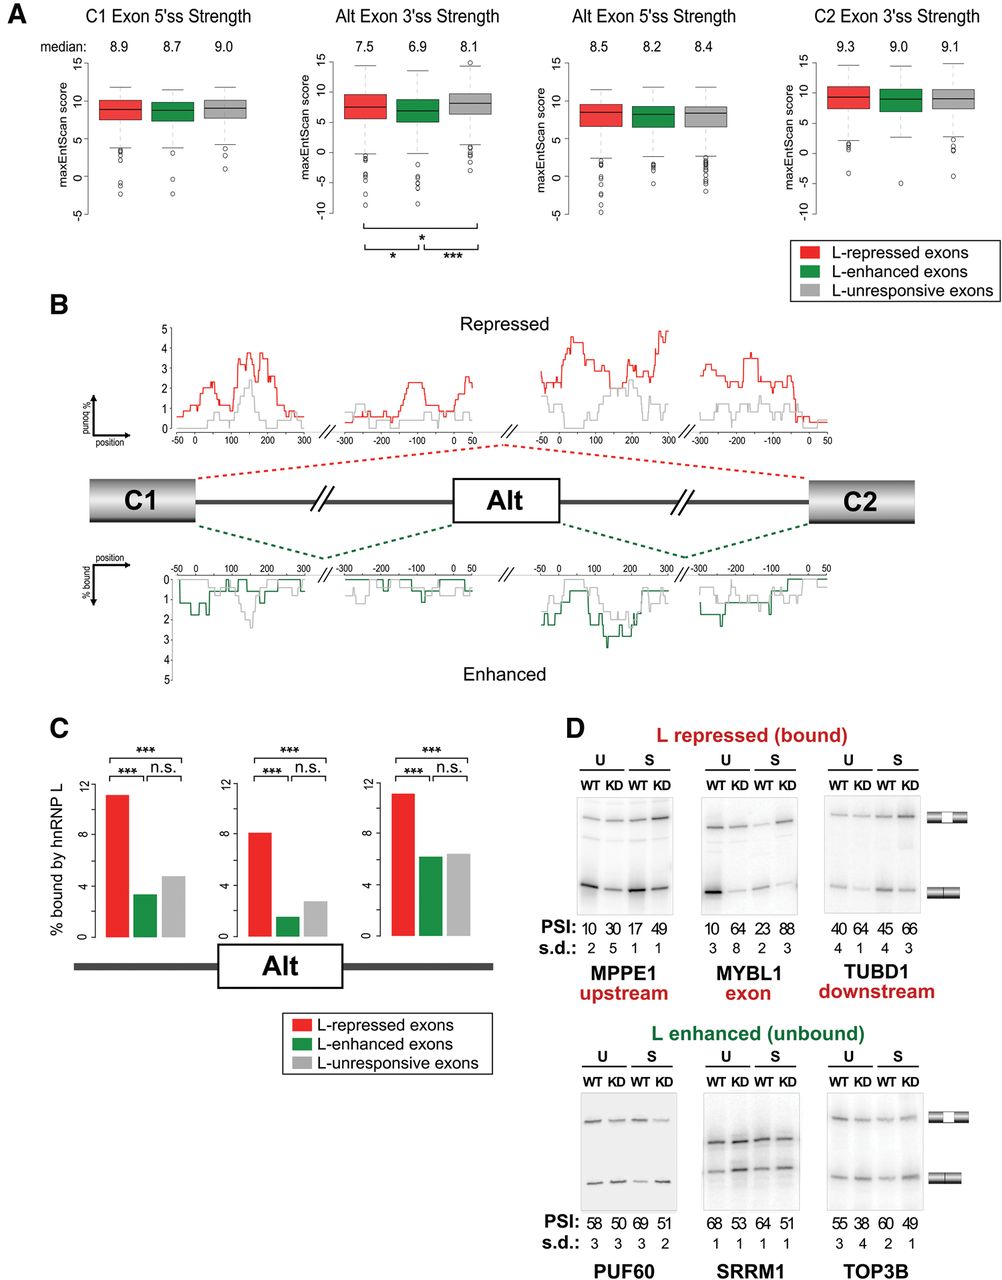
Exon repression by hnRNP L correlates with direct binding, while exon enhancement does not. (A) Box plots of splice site scores calculated by MaxEnt (Yeo and Burge 2004) for the 5′ and 3′ splice sites of hnRNP L-responsive cassette exons and their flanking exons, compared with hnRNP L-unresponsive cassette exons. hnRNP L-responsive and unresponsive categories are as defined in the text. Median values for each category are given above the plots. (B) Fraction of cassettes containing hnRNP L binding sites defined by CLIP-seq at single-nucleotide resolution within and around hnRNP L-repressed (red) and unresponsive (gray) cassette exons (top) or hnRNP L-enhanced (green) or unresponsive (gray) cassette exons (bottom). (C) Total percent of stringently defined (see text) hnRNP L-responsive and unresponsive cassette exons that contain a CLIP-seq signal for hnRNP L binding anywhere within the exon, or within a 300-nt region of flanking intron. (D) Representative RT-PCR gels of splicing changes observed in wild-type (WT) and hnRNP L-depleted conditions (KD) under unstimulated (U) or stimulated (S) conditions. Mean PSI and standard deviation (SD) are given below gels. In all cases (*) P < 0.05, (**) P < 0.01, (***) P < 0.001.




