


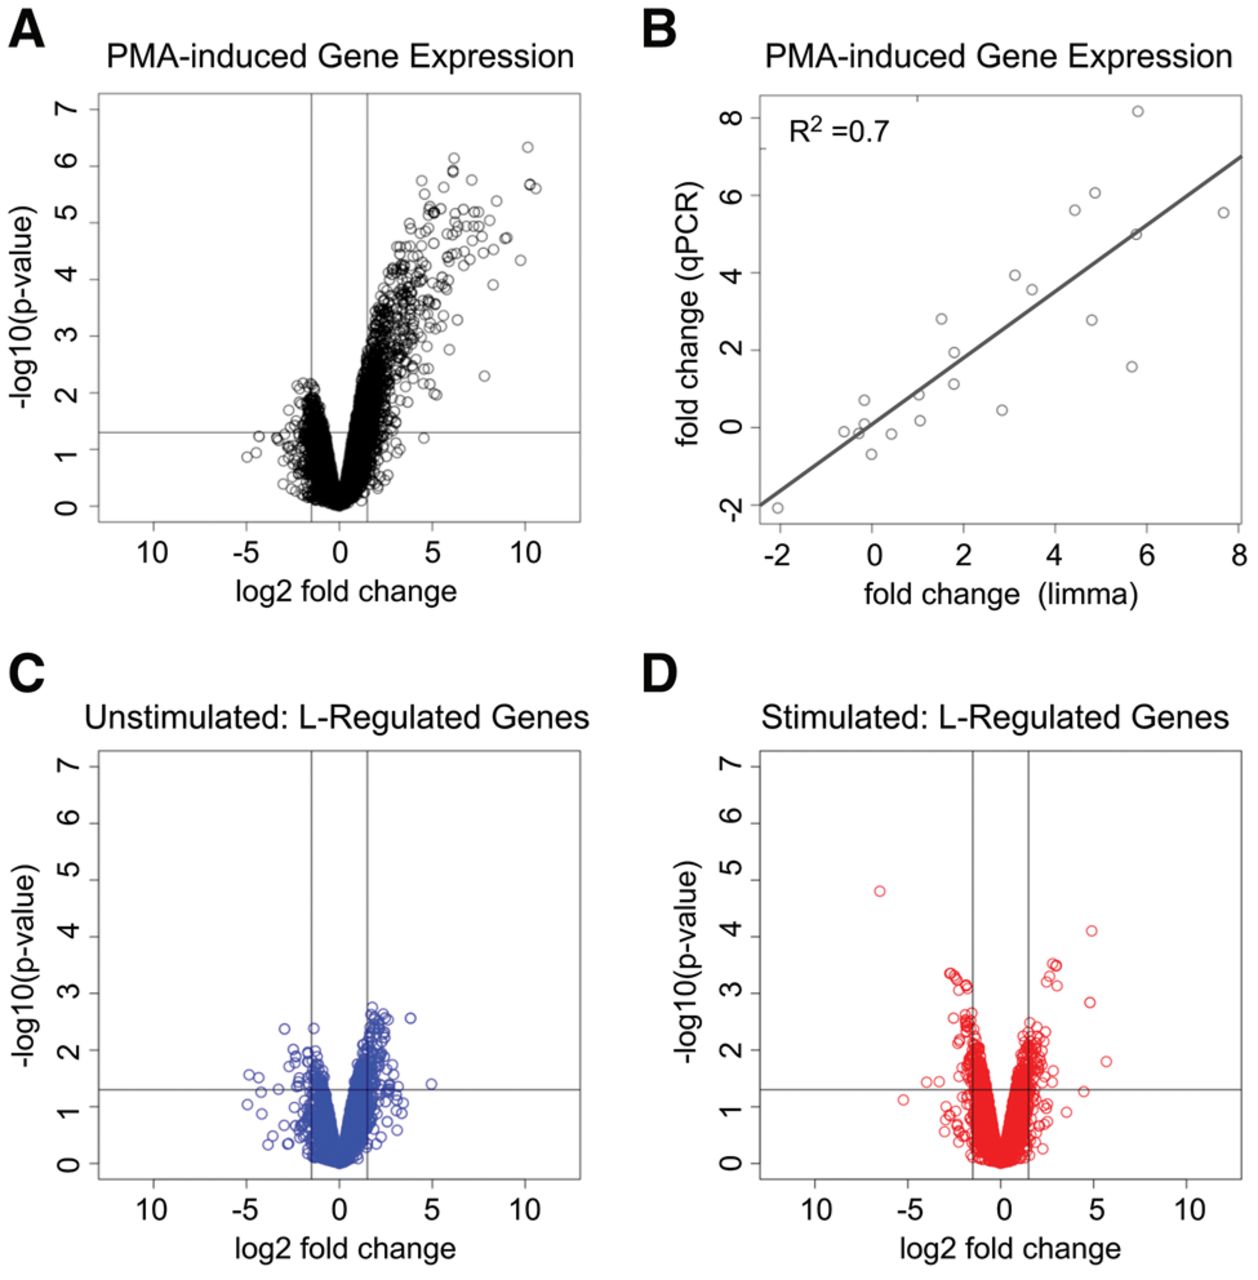
Gene-expression analysis of hnRNP L-responsive differential gene expression. (A) Volcano plot of differential mRNA expression following PMA stimulation of Jurkat cells as determined by limma analysis of RNA-seq data. Vertical lines represent a 1.5-fold log2 change in expression. (B) Regression analysis of qPCR validation of PMA-induced differential transcript levels compared with limma inferred values from the RNA-seq data. (C) Volcano plot of hnRNP L depletion-induced differential mRNA expression in unstimulated Jurkat cells. (D) Volcano plot of hnRNP L depletion-induced mRNA gene expression in PMA-stimulated cells. Vertical lines in A,C,D represent an absolute log2 change in mRNA expression of 1.5-fold.




