


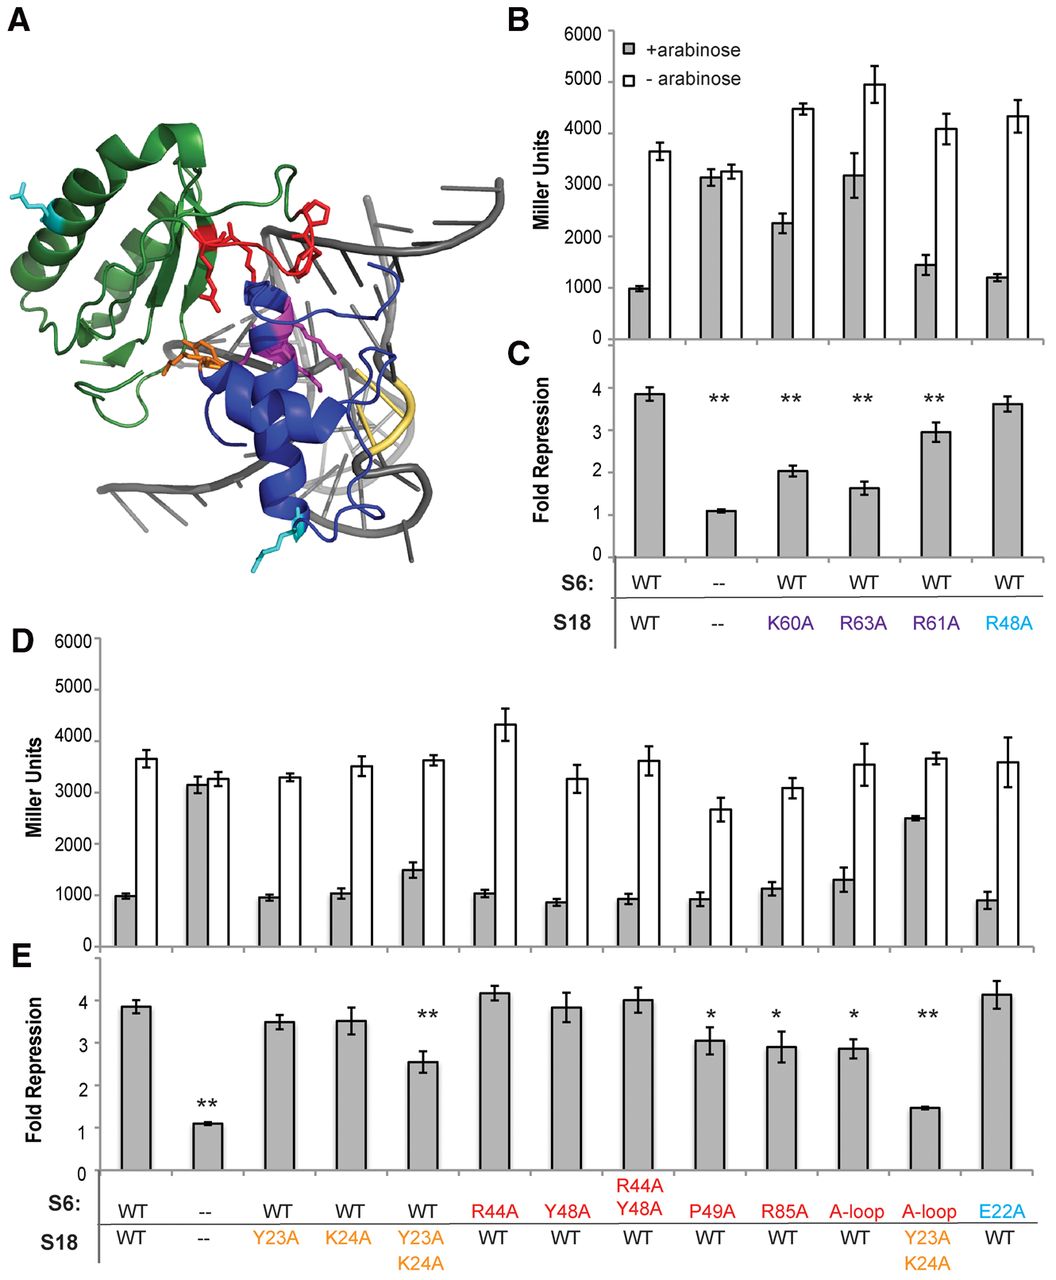
(A) Rendering of S6:S18 heterodimer in complex with the rRNA (coordinates derived from 2QAL [Borovinskaya et al. 2007]). The rRNA segment (660–678; 713–739) is gray, interacting bases C719 and C720 are highlighted in yellow, S18 is shown in blue, amino acids mutated at the S18:RNA interface (K60, R61, and R63) are indicated in purple, and amino acids mutated at the S6:S18 interface (Y23 and K24) are orange. S6 is displayed in green, and the amino acids mutated in the S6:S18 interface are highlighted in red. For individual amino acids mutated at the S6:S18 interface (R44, Y48, P49, and R85), side chains are displayed; for the additional amino acids altered in the “A-loop” mutant (44–49 all mutated to alanine), only the backbone is colored. Negative control mutations (S6 E22 and S18 R48) are highlighted in cyan. (B) β-galactosidase activity of cells carrying the rpsF-priB-rpsR overexpression construct with mutations to the S18 RNA-binding region with protein induced and uninduced (±arabinose). For comparison, data for the unmutated construct and empty vector (--) are included. (C) Fold repression for S18 RNA-binding site mutations calculated as described in Figure 1C. (**) Statistically significant change (P < 0.01) from the wild-type construct. (D) β-galactosidase activity of cells carrying the rpsF-priB-rpsR overexpression construct with mutations made to the S6:S18 interface. For comparison, data for the unmutated construct and empty vector (--) are included. (E) Fold repression for S18:S6 binding interface mutations calculated as described in Figure 1C. (**) P < 0.01, (*) P < 0.05.




