


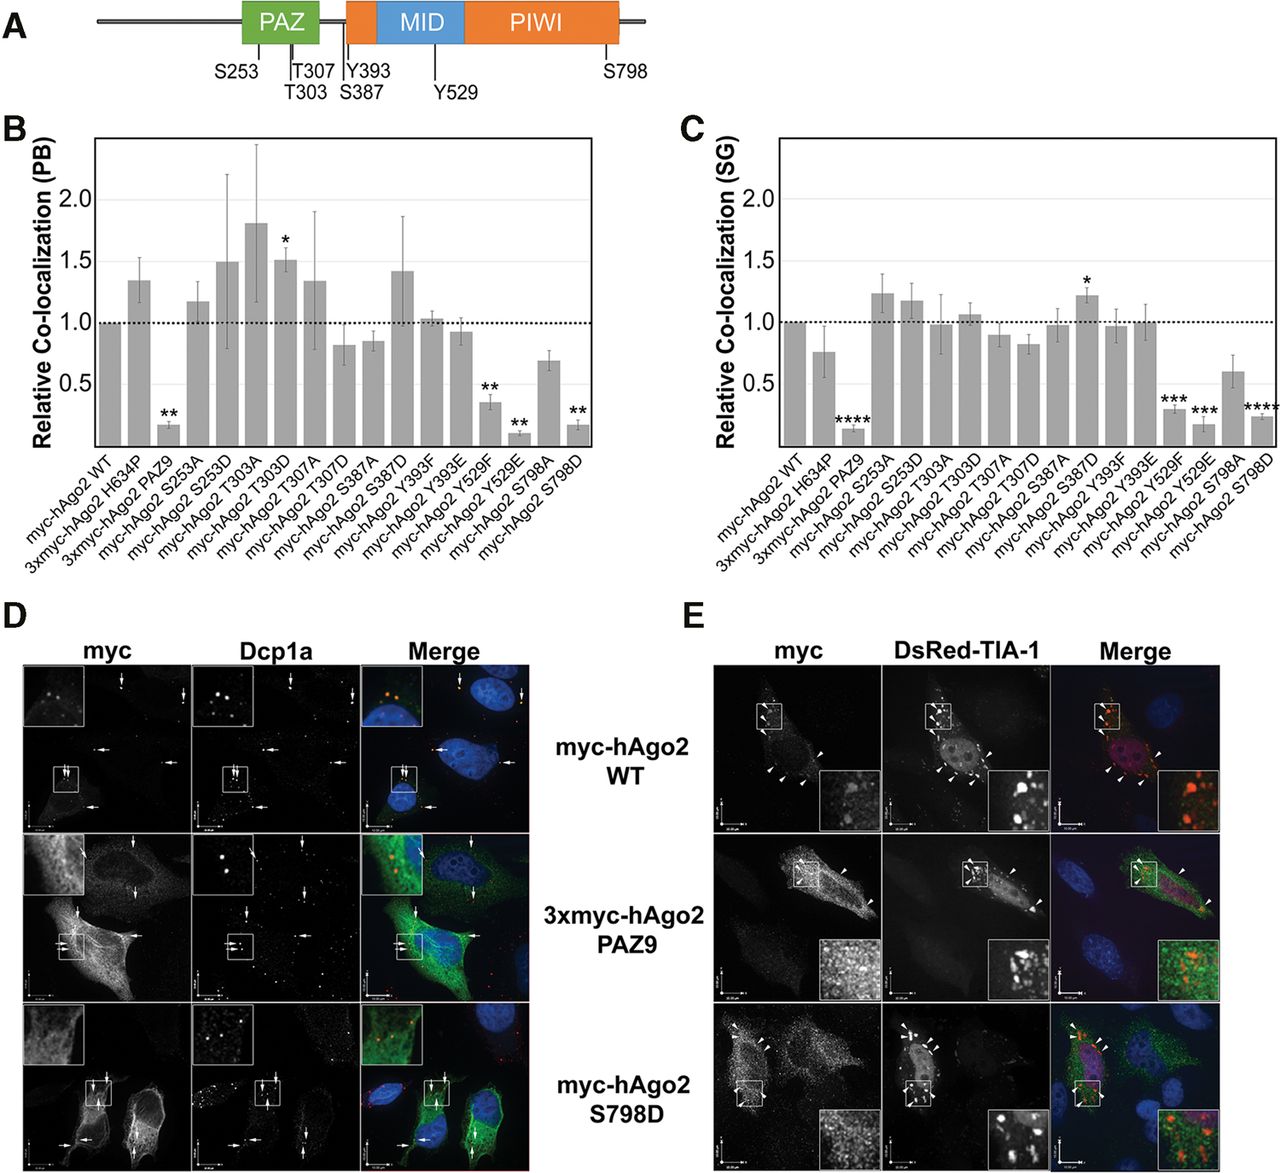
Localization of Ago2 phosphorylation mutants. (A) Schematic representation of Ago2 domains and known phosphoamino acid residues. (B) HeLa cells transiently transfected with plasmids expressing wild-type or mutant Ago2 were processed for indirect immunofluorescence (IIF) microscopy. Dcp1a-positive P-bodies were analyzed for Ago2 signal using quantitative laser scanning cytometry. The colocalization between Ago2 and Dcp1a for all mutants is relative to wild type, which was set to 1.0. (C) HeLa cells were transiently cotransfected with plasmids expressing wild-type or mutant Ago2. Before processing for IIF microscopy, cells were treated with 500 µM sodium arsenite for 45 min. Stress granules positive for endogenous TIA-1 were analyzed for Ago2 signal using quantitative laser scanning cytometry. The colocalization between Ago2 and TIA-1 for all mutants is relative to wild type, which was set to 1.0. Paired Student's two-tailed t-test were used to compare relative colocalization of mutant Ago2 and RNA granule to that of wild-type Ago2. Error bars indicate SE. (D) HeLa cells transiently transfected with plasmids expressing myc-tagged Ago2 (wild type, PAZ9, or S798D) were processed for IIF microscopy. Exogenously expressed Ago2 was detected using an anti-myc antibody. Dcp1a-positive P-bodies are marked by arrows. (E) HeLa cells were transiently cotransfected with plasmids expressing myc-tagged Ago2 (wild type, PAZ9, or S798D) and DsRed-tagged TIA-1. Following treatment with 500 µM sodium arsenite for 1 h, cells were processed for IIF microscopy. Exogenously expressed Ago2 was detected using an anti-myc antibody. TIA-1-positive stress granules are marked by arrowheads. Outlined regions are expanded in inset. Scale bars, 10 µm. (*) P < 0.05; (**) P < 0.01; (***) P < 0.001; (****) P < 0.0001.




