


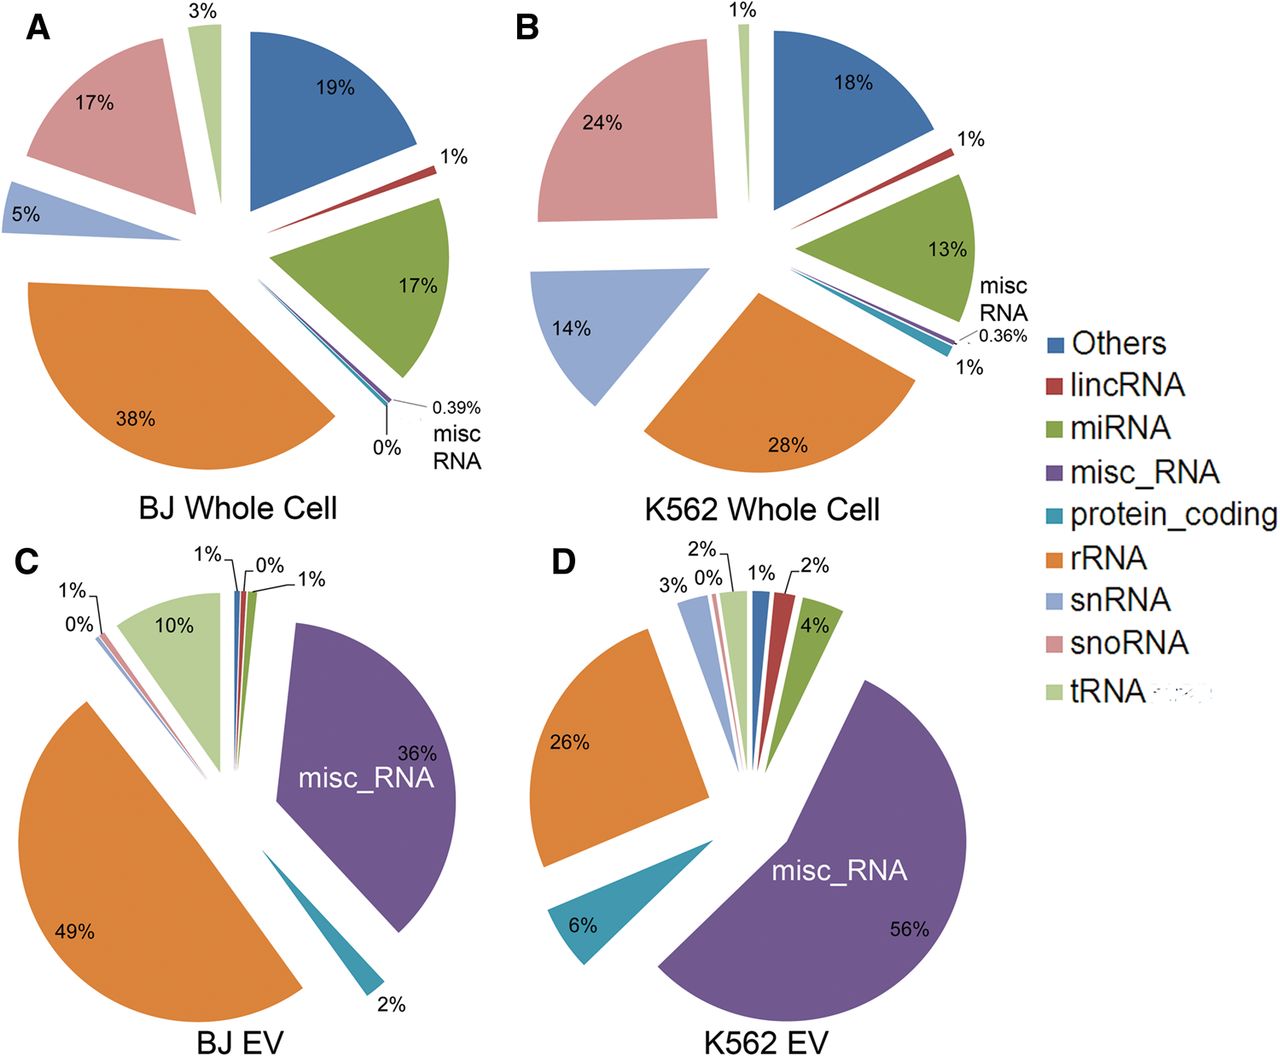
FIGURE 2.
Pie charts representing the relative abundance of families of RNA within BJ whole cell (A), K562 whole cell (B), BJ EV (C), and K562 EV (D). The group labeled as “Others” in the pie charts is representative of reads derived from several Gencode annotation categories such as pseudogenes, antisense intronic, mitochondrial t-RNA, vault RNA, immunoglobulin genes, etc.




