


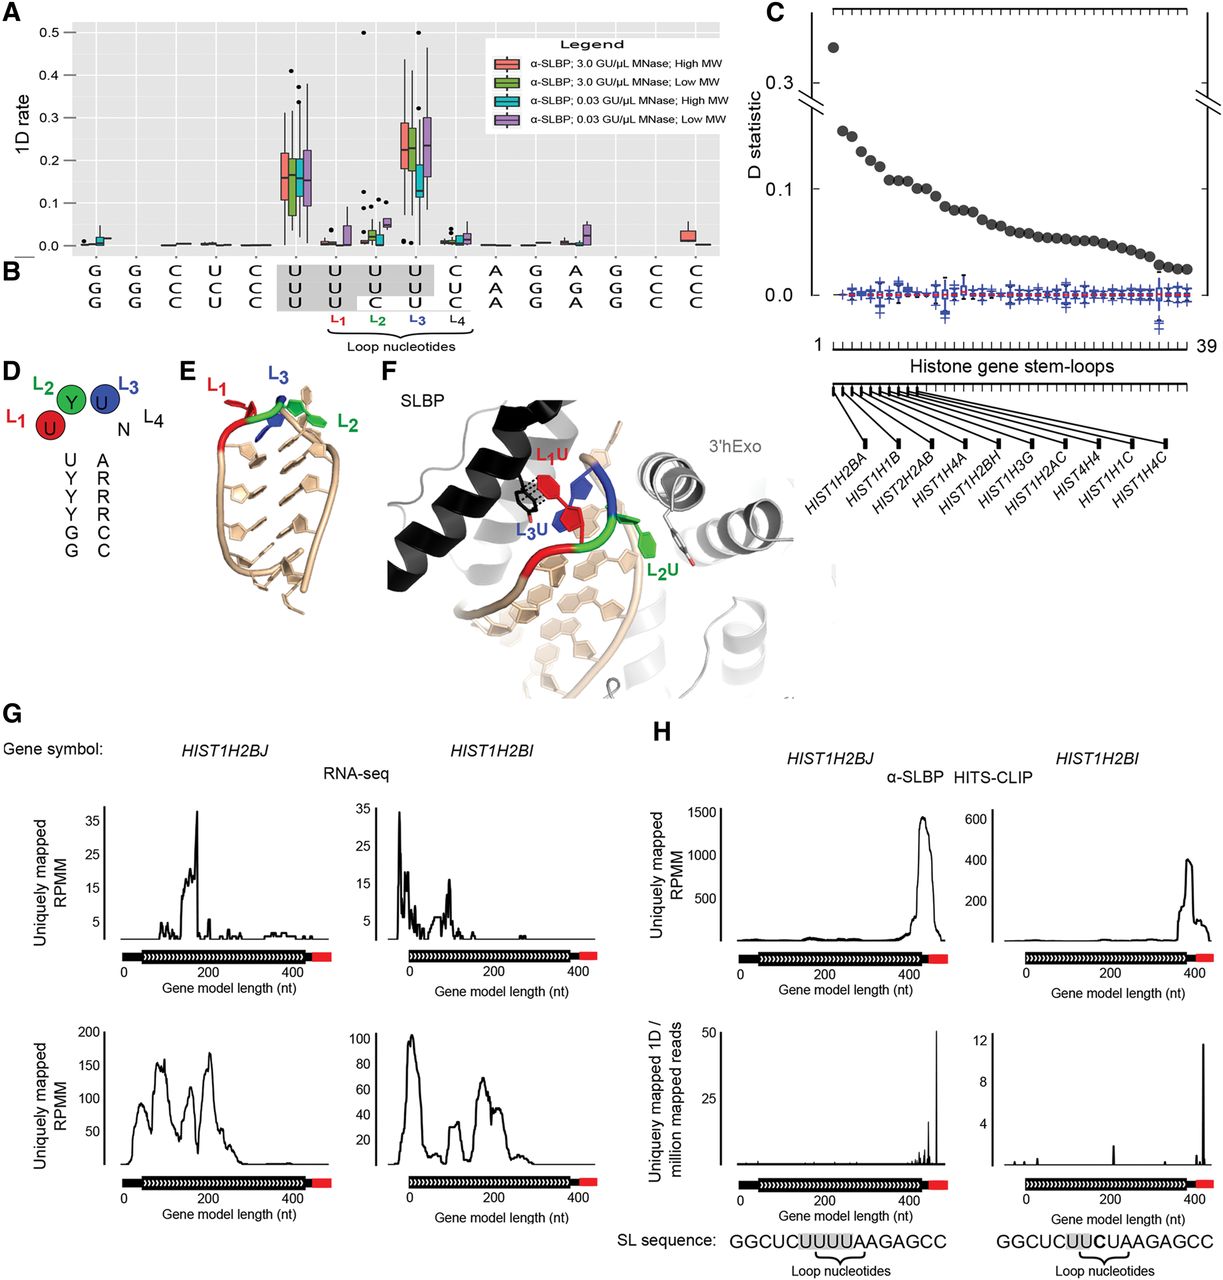
Identification of crosslink-induced mutations (CIMS) in histone mRNA stem–loops. (A) Single nucleotide deletion (1D) rates were quantified across 75 histone SL motifs. The distribution of those rates is summarized by a boxplot spanning each nucleotide in the degenerate motif. (B) The number of genomic occurrences of each stem–loop sequence is indicated by the pseudocolor plot alongside each stem–loop. If a 1D maps to a homopolymer run (highlighted in gray in panel B), then the BWA aligner ascribes the 1D to one of the terminal nucleotides in the run depending on whether the gene is on the plus or minus strand in the genome. (C) We implemented a previously published method (Zhang and Darnell 2011) to compute a test statistic (referred to here as “D-statistic”) to assess enrichment of 1Ds in the loop region. The D-statistic computed for each of the histone genes is depicted as a scatter plot. We calculated a P-value by computing a null distribution for the D-statistic at each stem–loop motif using the resampling method from the previously reported method (Zhang and Darnell 2011). The null distributions are displayed as boxplots. Thirty-nine of the histone stem–loops passed the significance cutoff (P < 0.001). (D) Highlighted are the three uracils in the stem–loop consensus sequence. (E,F) Those uracils are indicated in the stem–loop RNA fragment (E) that is a component of an SLBP:SL:3′hExo crystal structure (PDB4HXH) (Tan et al. 2013). (G) Coverage vectors for two histone genes with different loop sequences. There are three histone genes which contain a UCUN loop: HIST1H2BI (UCUA), HIST1H4L (UCUC), and HIST1H3E (UCUC). HIST1H2BI was expressed at similar levels to the adjacent gene HIST1H2BJ with a UUUA loop. In both public data sets (Yang et al. 2011; Djebali et al. 2012) and in our RIP-seq experiment, these genes were expressed at similar relative levels. The top left graphs show the coverage vector in the poly(A)-RNA-seq data set (Yang et al. 2011). The bottom left row shows the coverage in our SLBP RIP-seq data set. (H) The top right shows the coverage in our SLBP HITS-CLIP data set in the 3 GU/μL Mnase/High MW fraction. The bottom right shows the 1-bp deletions found in each gene model. Each vector is shown relative to the gene model along the x-axis with the 3′ UTR containing the histone SL indicated in red and CDS indicated in black. Quantification of CIMS in the HIST1H2BJ (UUUA) and HIST1H2BI shows accumulation of CIMS in the homopolymer run of uridines across the loop. In HIST1H2BJ the CIMS are located in the stretch of four uridines at the top of the stem and the first 3 nt of the loop, and the precise nucleotide crosslinked cannot be assigned. There are fewer CIMS in the HIST1H2BI with the majority associated with the UU at the top of the stem and first nucleotide in the loop (L1). This most likely represents crosslinking to L1. A small number of CIMs were associated with the naturally occurring L2C.




