


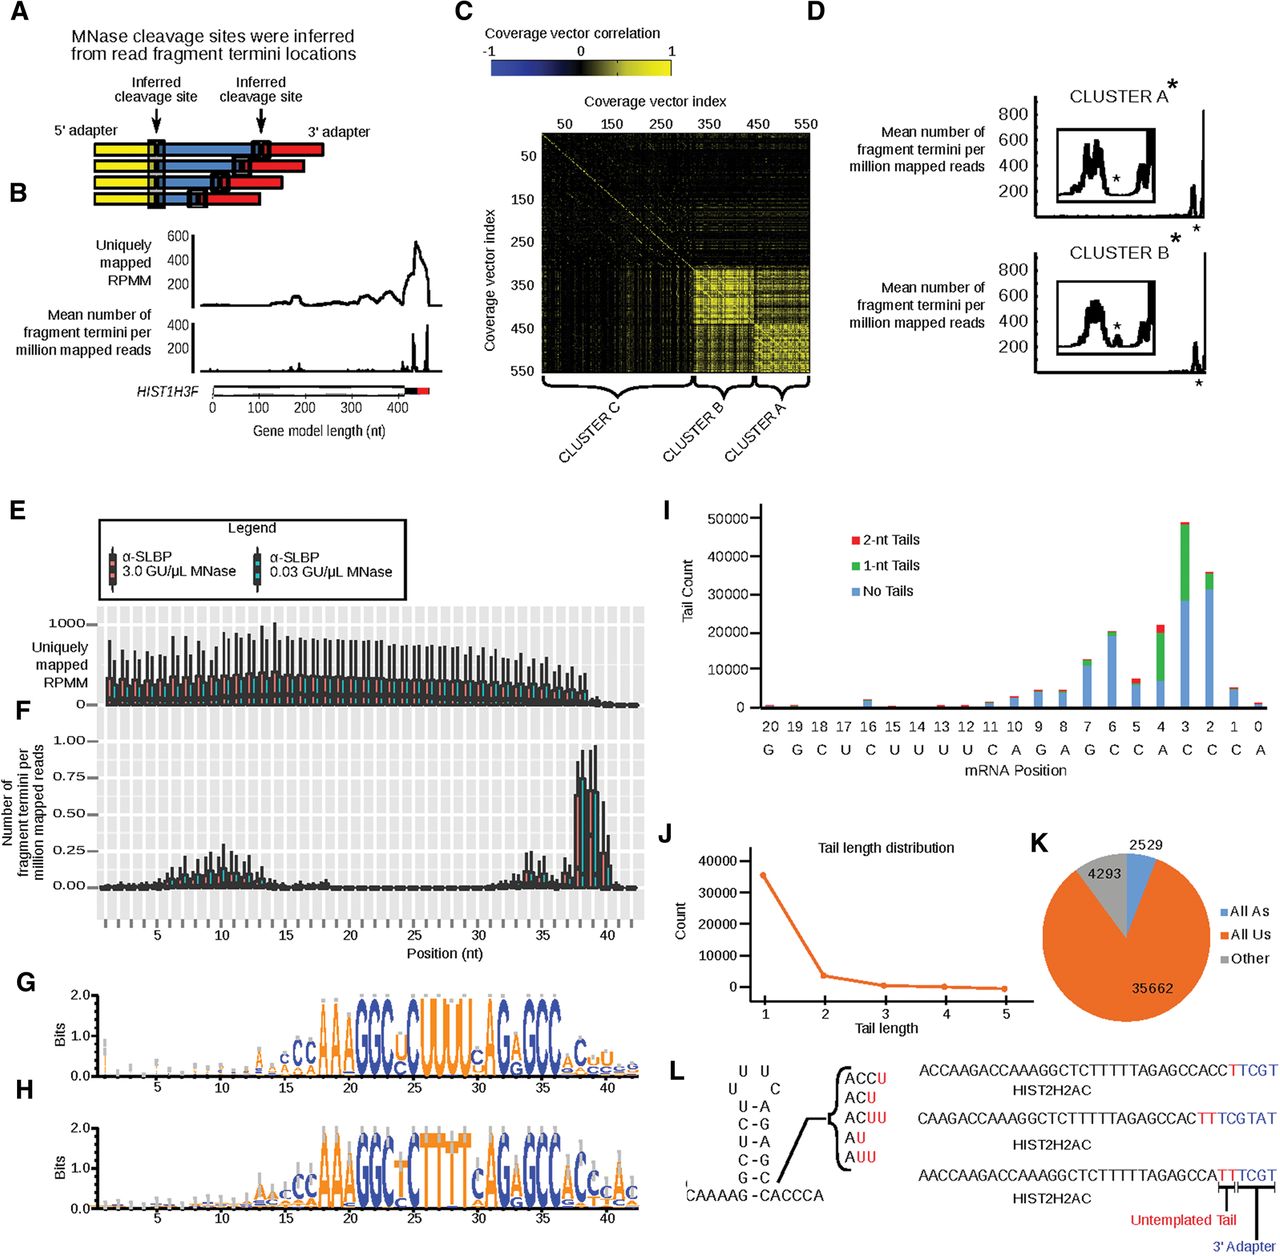
Inference of nuclease cleavage sites from HITS-CLIP data maps the boundaries of the SLBP RNP. (A) Cleavage sites were inferred from mapping read termini as depicted. Only termini for which 5′ and 3′ cleavage sites could be mapped were retained and graphed. The sequencing was 36-bp single end and occurred from the 5′ adaptor. (B) A representative coverage plot is shown with coverage expressed as unique reads per million mapped (RPMM) across the HIST1H3F locus (upper panel). A plot of the inferred cleavage sites is also shown for comparison, where the number of cleavage sites per million mapped reads is shown. The inferred cleavage sites precisely flank the histone SL, which is indicated in the gene model schematic as a red block. (C) We used CVCA analysis to group histone genes by the similarity of the inferred cleavage site distributions at each locus using the same HGNC gene models shown in Figure 3. (D) The mean cleavage site vectors show that the cleavage peak is most sharply demarcated at the 3′ region flanking the SL and that there was only a subtle difference between histone genes in clusters A and B, which is a density of cleavage sites internal to the histone SL (see insets). (E,F) We quantified the number of unique RPMM (E) and cleavage rates (F) for each nucleotide in the SL motifs of 75 histone genes for the low MW band (blue) and HMW weight band (orange). (G,H) Seqlogos (WebLogo 3.3) were generated from a multiple alignment of SLBP HITS-CLIP reads containing the histone SL motif (G) and for the DNA sequence for 3′ end of the histone genes (H). Note that the x axis is the same for the boxplots (E,F) and the seqlogos (G,H) to display the sequence composition of the nuclease-resistant histone SL RNA fragments. (I) We used the AppEnD tool (Welch et al. 2015) to identify nontemplated tails on the 3′ ends of histone RNA molecules present in HITS-CLIP reads. To avoid calling sequencing errors as tails, only reads that extended at least 4 nt into the 3′ adapter were analyzed. The bar chart shows abundances of unmodified tails (blue), 1-nt tails (green), and 2-nt tails (red) by position from 3′ end for all histone mRNAs. (J,K) The length and composition of the nontemplated tails were determined. (L) Examples of types of reads found on the HIST2HAC RNA are shown. The 3′ end of the RNA that mapped to the genome (black) is followed by any nontemplated nucleotides (red) and the 3′ linker (blue).




