


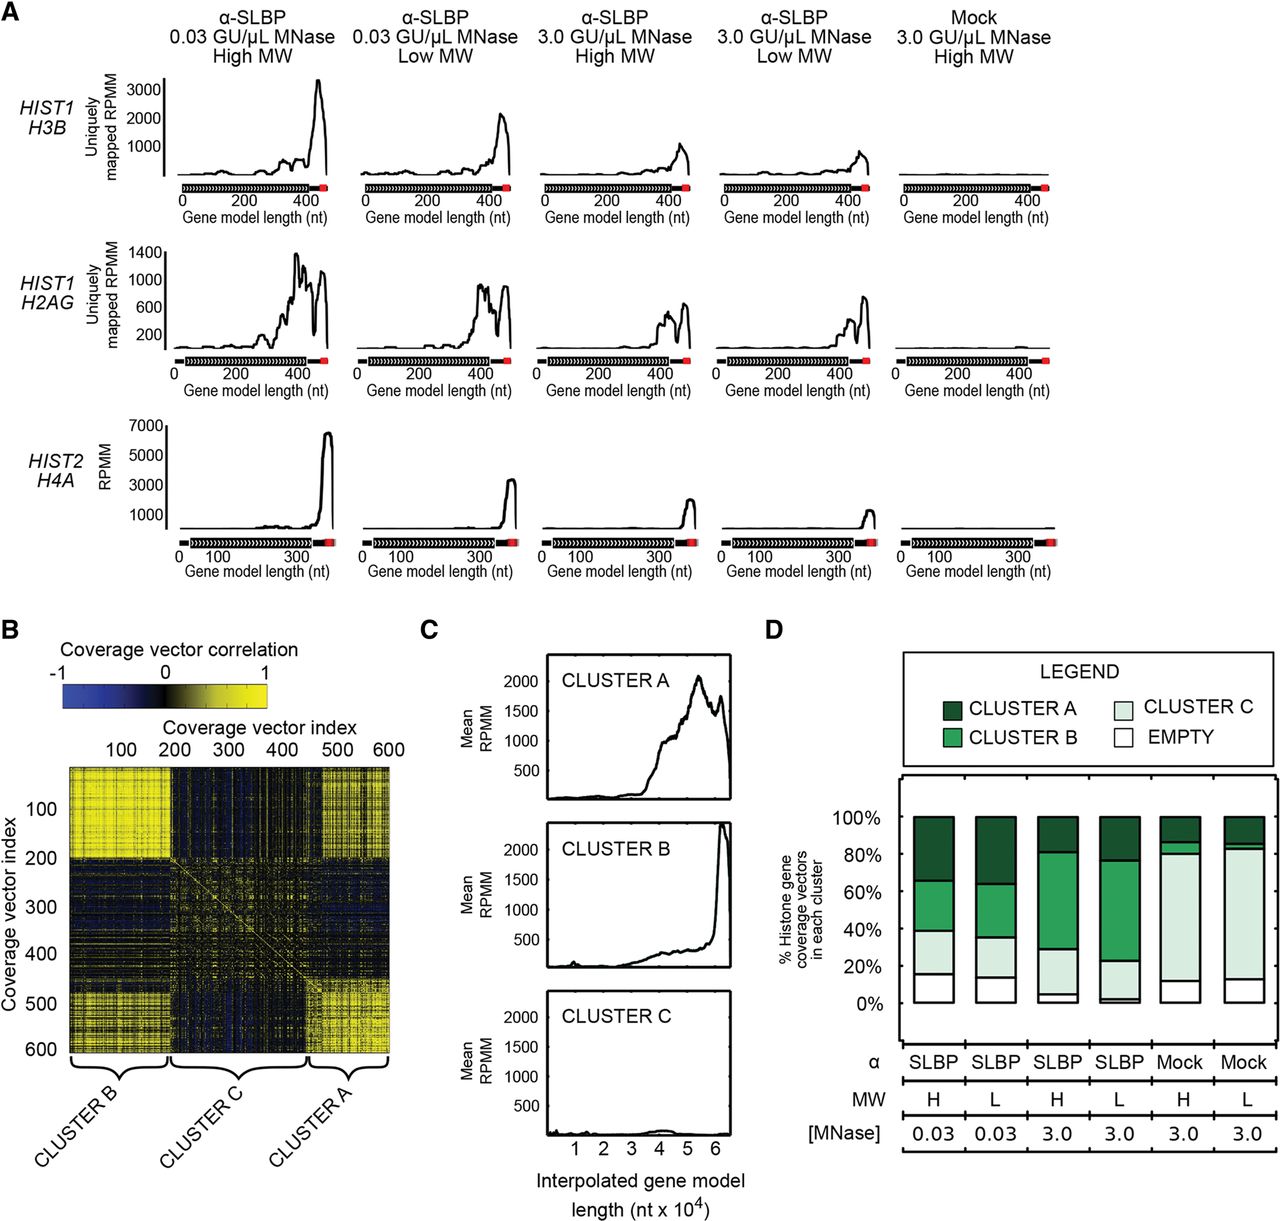
HITS-CLIP read coverage maps for representative histone mRNA gene models. (A) Representative coverage plots for select RD histone mRNAs are shown. The uniquely mapped reads for the HIST1H3B and HIST1H2AG genes are also shown. Multimapped reads are shown for HIST2H4A, which is a duplicated gene with reads mapping to both gene copies of the gene in the genome sequence. The coverage distributions are expressed as reads per million mapped (RPMM). (B) To identify commonly observed coverage vector shapes across the histone mRNAs, we developed coverage vector correlation analysis (CVCA), which was applied to the 696 coverage vectors derived from 116 histone gene models in the six different conditions. Symmetric correlation map shows each of the 696 coverage vectors plotted against one another and the correlation coefficient is indicated in the heatmap. We find three major clusters that are labeled A, B, and C. (C) The mean coverage vector for each group is displayed. Average coverage vector for the three clusters found by CVCA show two distinct shapes and one comprised of background level reads. The vectors in group C are either histone genes not expressed, non-replication-dependent histone genes, or correspond to vectors from the GFP controls. (D) Proportion of histone gene models found in each cluster from C is shown across HITS-CLIP conditions. This quantifies the proportion of genes that are most similar to a given coverage shape.




