


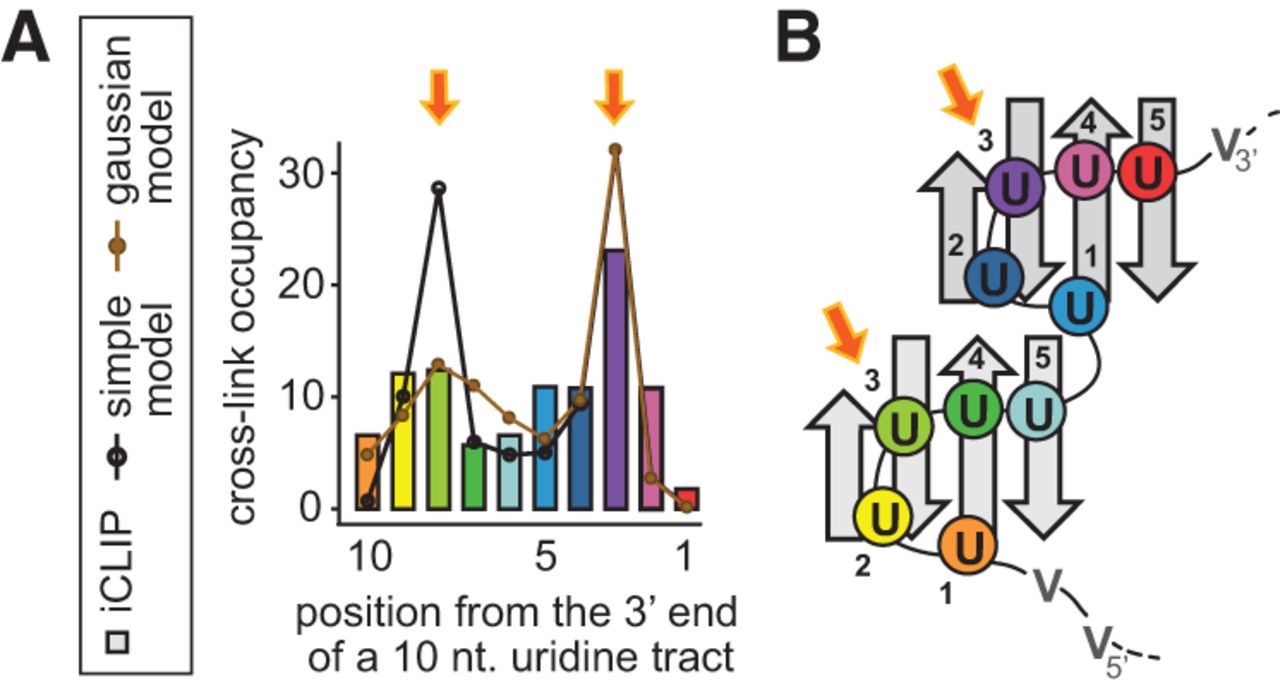
FIGURE 4.
Comparison between the cross-link frequencies observed within a uridine tract of 10 nt and the predicted register occupancy of such a tract by the RRM dimer. (A) The two thermodynamic models are superimposed on the iCLIP data (figure adapted with permission from Macmillan Publishers Ltd. © 2010 [König et al. 2010]). The iCLIP positions are color-coded to match the uridines with nucleotide pockets in the structural model (B) of the RRM dimer binding the (U)10 tract in the favored register. The two cross-linking maxima, highlighted by orange arrows, match the RRM pockets where the cross-link formation was predicted (pocket 3, Cieniková et al. 2014).




