


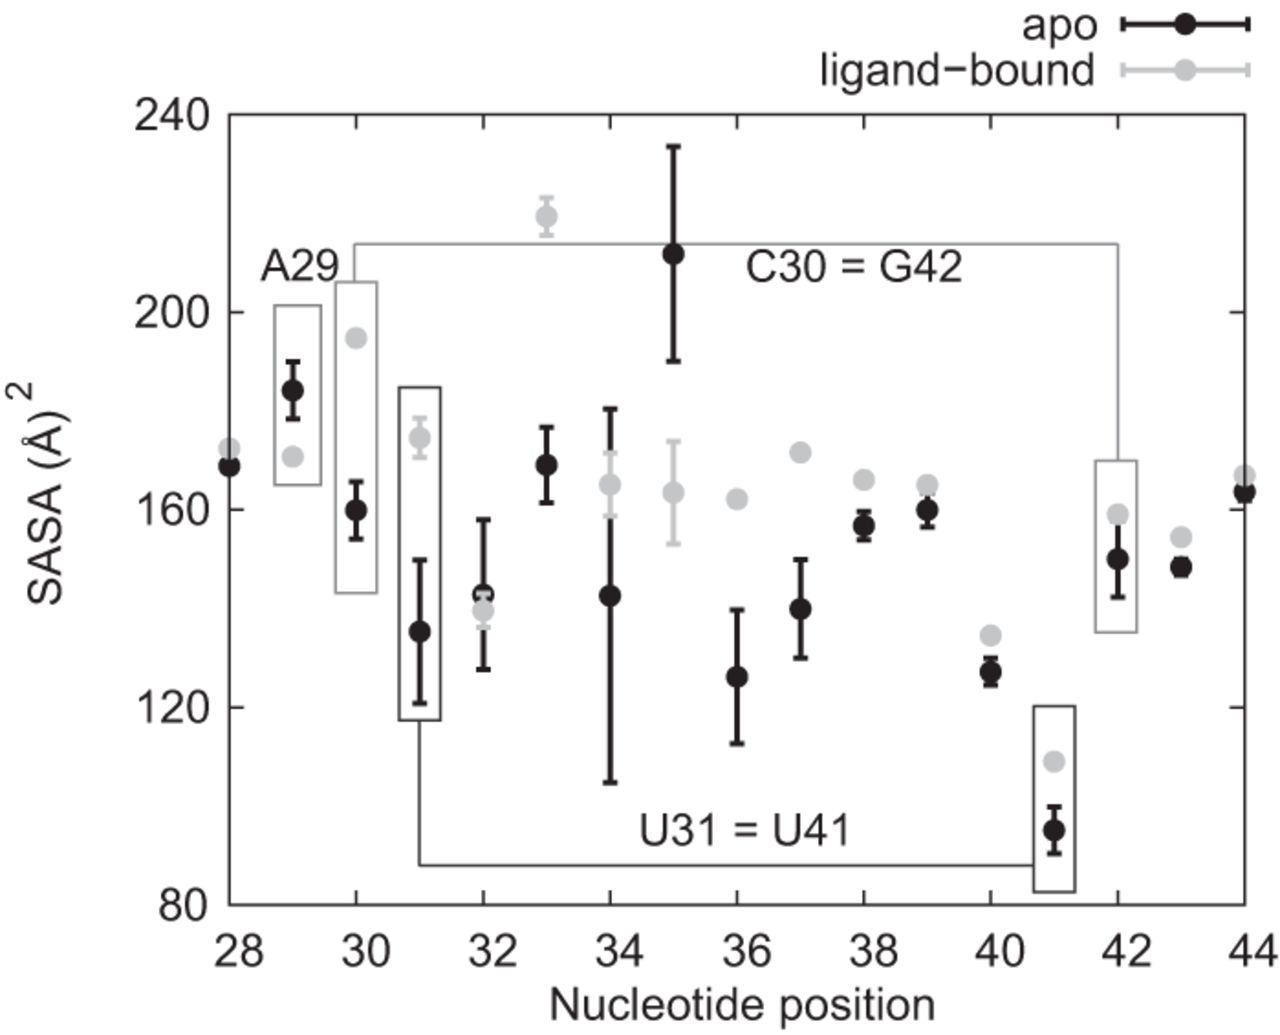
FIGURE 9.
Solvent accessible surface area (SASA) per nucleotide, averaged over the last 1.2 μsec of production simulation time. For this analysis, the ligand-bound simulations were controls in order to identify conformational switching in the apo simulations. Nucleotide A29 became more exposed and nucleotides C30, G42, U31, and U41 formed new base pairs, as shown by the lower SASA compared to the ligand-bound simulations. The error bars indicate the standard error of the mean for the four simulations. The results of the individual simulations are provided as Supplemental Figure S6.




