


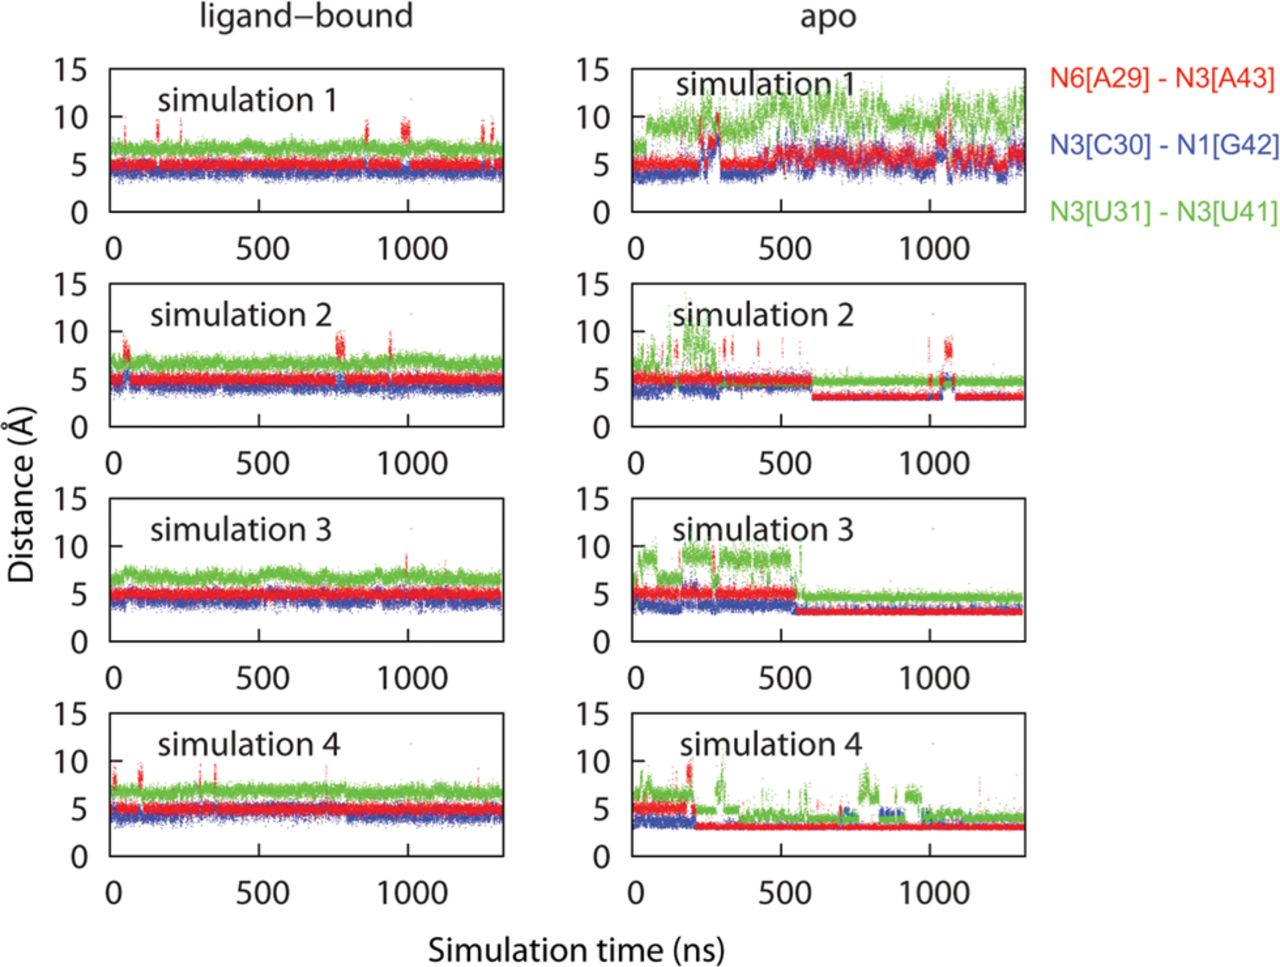
Distances between base atoms in the binding pocket. The distance between N6 of A29 and N3 of A43 (red dots) of ∼6 Å corresponds to a Watson–Crick G42•A29 noncanonical interaction, as observed in the crystal structure in the binding pocket ceiling; the distance of ∼2.8 Å corresponded to a trans-Hoogsteen/sugar-edge A29•A43 interaction that emerged in the apo simulations. Simulations 2, 3, and 4 of the apo structure showed similar trends, but larger fluctuations were observed in simulation 1. Three distances are color-coded as shown in Figure 6 legend. These distances were selected to monitor new base pairs that were observed in the apo simulations.




