


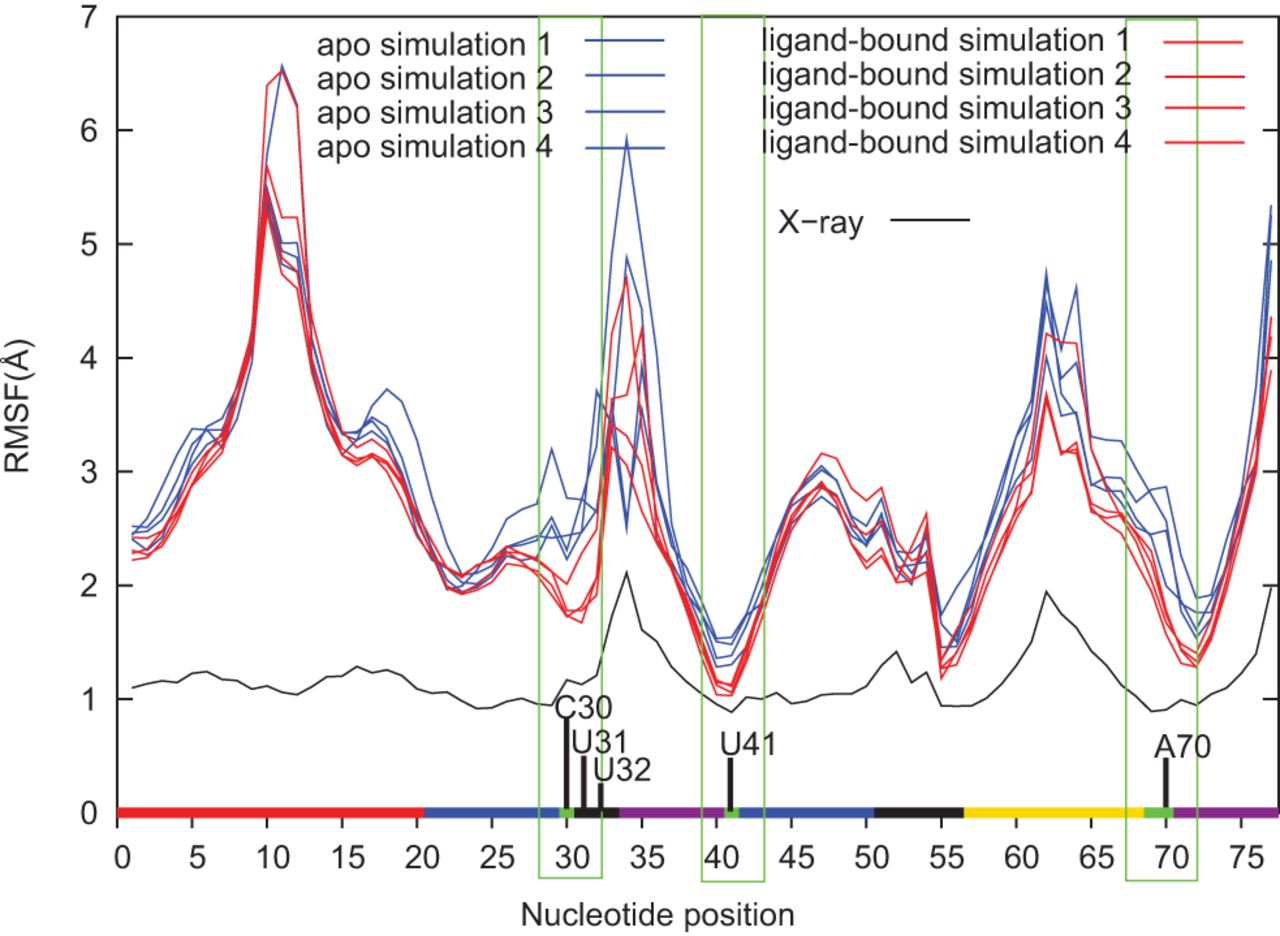
FIGURE 3.
RMSF averaged over each nucleotide. Apo simulations are plotted with blue lines and ligand-bound simulations are plotted in red lines. The fluctuation data (black line) estimated from the temperature factors of the crystal structure using Equation 1 is also included for comparison. Ligand binding regions are boxed in green rectangles. The x-axis is color-coded according to the secondary structure regions shown in Figure 1.




