


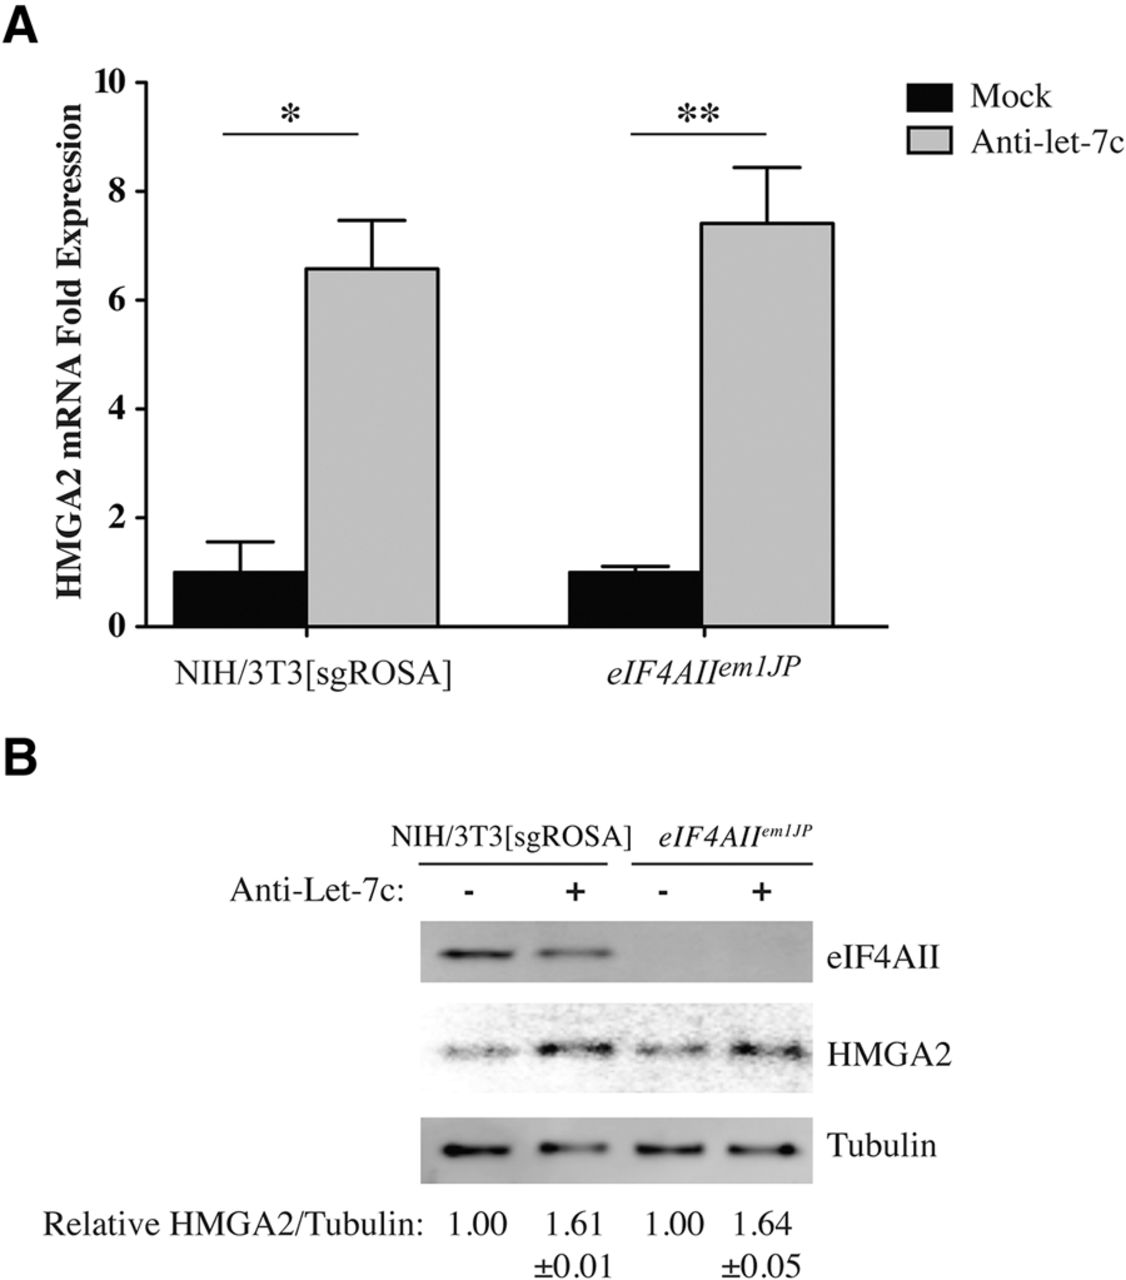
FIGURE 5.
(A) RT-qPCR analysis of HMGA2 mRNA expression levels. Cells were transfected with Anti-let-7c twice and total RNA was harvested 24 h after the last transfection. HMGA2 mRNA expression levels are standardized to GAPDH and plotted relative to the mock transfections for each cell line. N = 3 ± SEM. (*) P < 0.05, (**) P < 0.01. (B) Western blot assessing the effect of Anti-let-7c on HMGA2 protein levels. Cells were treated and harvested as in Figure 3A. Blots were probed with the indicated antibodies, then scanned and quantitated on the LI-COR Odyssey Image system. N = 3 ± SEM.




