


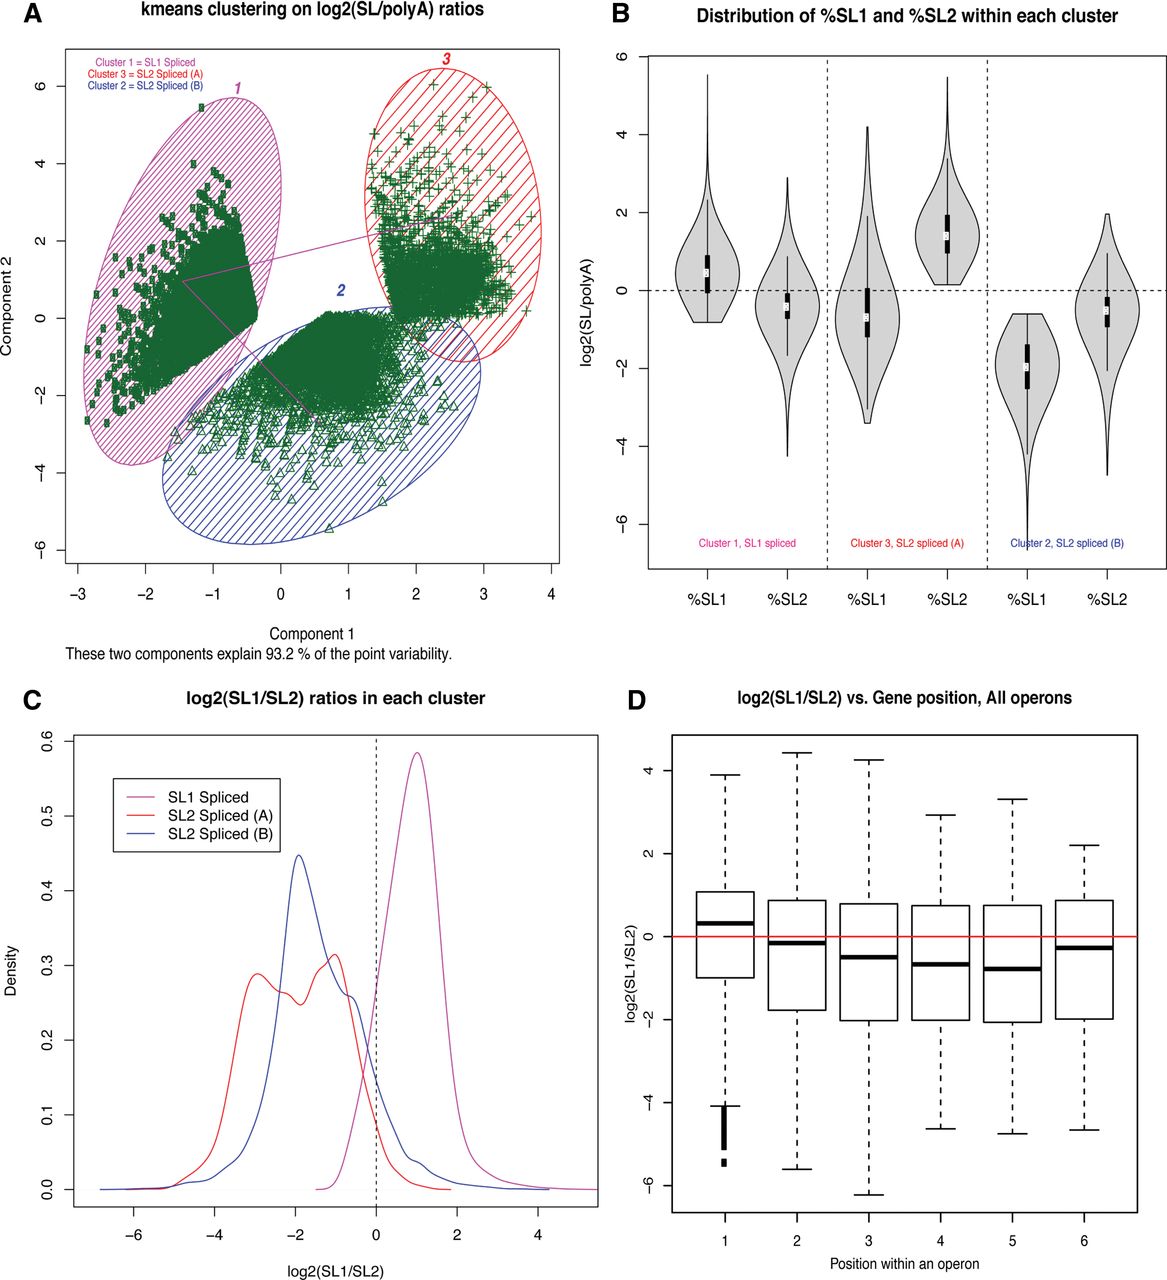
Distinct patterns of trans-splicing observed in P. pacificus transcriptome. (A) A k-means clustering on the fraction of SL1 and SL2 splicing for each gene reveals three distinct clusters. (B) A violin plot for the %SL1 and %SL2 for all genes within each of the three clusters shows that genes in Cluster 1 get higher SL1 than SL2, while the opposite is true for genes in Clusters 2 and 3. (C) The same trend is more clearly visible in density plots of relative SL levels (log2(SL1/SL2) for all genes within each of the three clusters. (D) Boxplots for relative trans-splicing levels for all the genes within all predicted operons indicate that the first gene in an operon tends to receive higher levels of SL1 than SL2, although outliers can be seen for all gene positions. Only gene positions 1 to 6 are shown in this plot, but the trend remains the same down to gene position 14, which is the maximum number of genes in an operon.




