


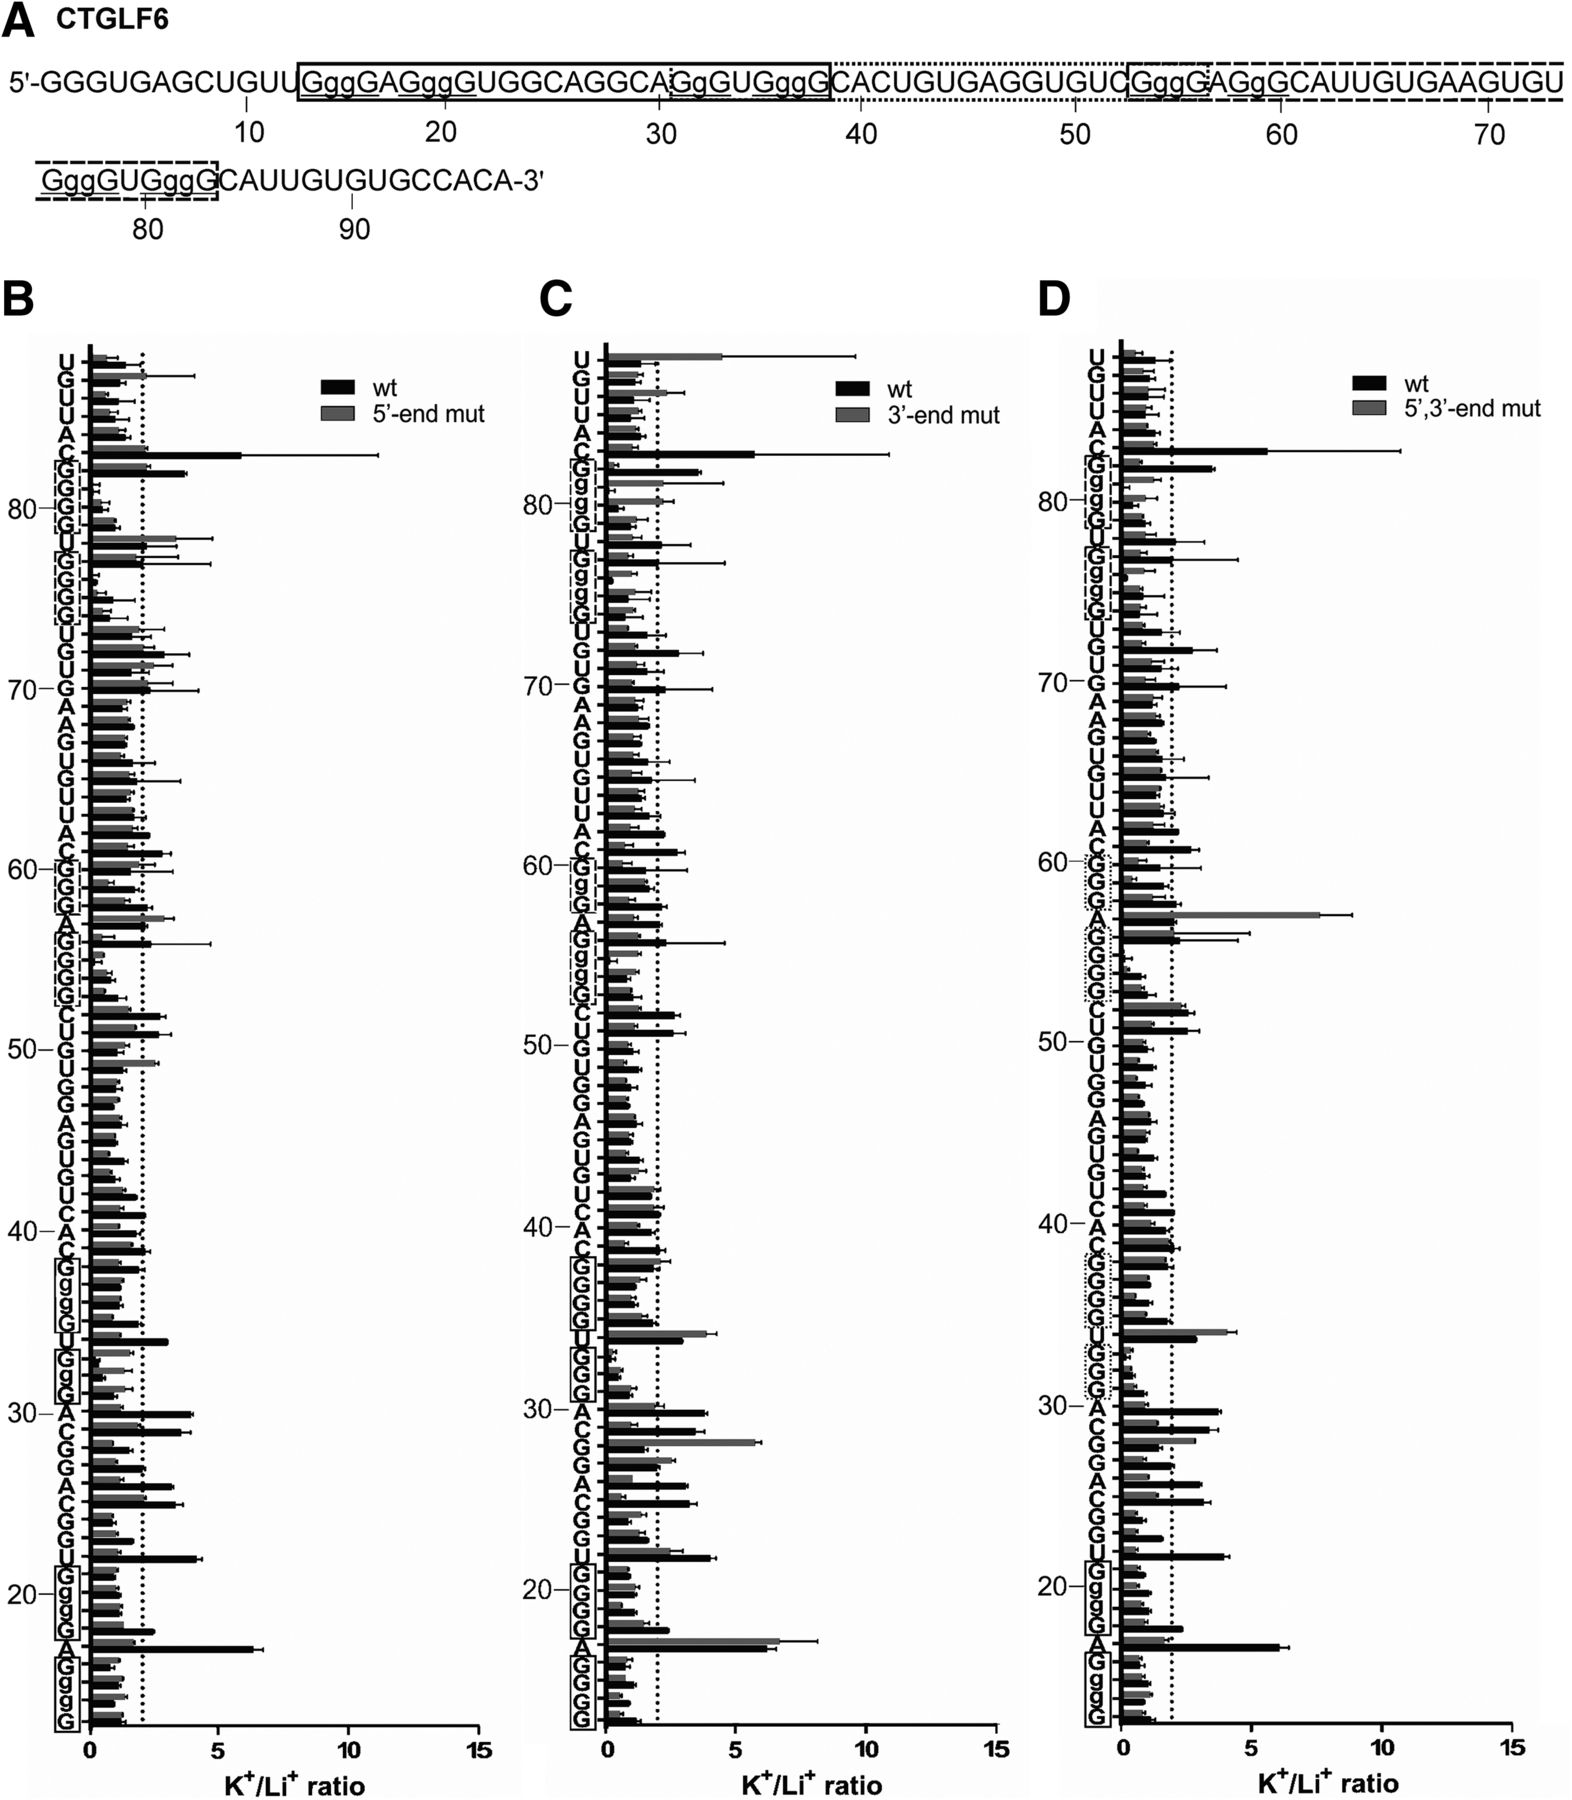
In-line probing results of the CTGLF6 PG4 candidate showing three overlapping PG4s, possessing a 10-, 16-, or 14-nt central loops. (A) Nucleotide sequence of the characterized CTGLF6 wt transcript. The lowercase guanines (g) correspond to those substituted for adenines in the G/A-mutant version. Underlined G-tracks indicate the predicted nucleotides involved in the G-quadruplex formation. The boxed sequences in different frames denote the predicted PG4s. (B–D) K+/Li+ ratios of the band intensities of the CTGLF6 wt and the different G/A-mutants in vitro G-quadruplex versions for each nucleotide. (B) CTGLF6 wt and 5′-end G/A-mutant, (C) CTGLF6 wt and 3′-end G/A-mutant, and (D) CTGLF6 wt and 5′-, 3′-end G/A-mutant. The K+/Li+ ratios are shown in dark gray for the CTGLF6 wt and in light gray for the different CTGLF6 G/A-mutants. The boxed guanines represent the predicted G-tracks. The dotted line represents the twofold threshold that denotes a significant gain in flexibility. The nucleotide sequence is indicated on the y-axis. The lowercase Gs shown on the y-axis are mutated to As in the mutant version. Each bar represents the average of two independent experiments, and the error bars represent the standard deviations.




