


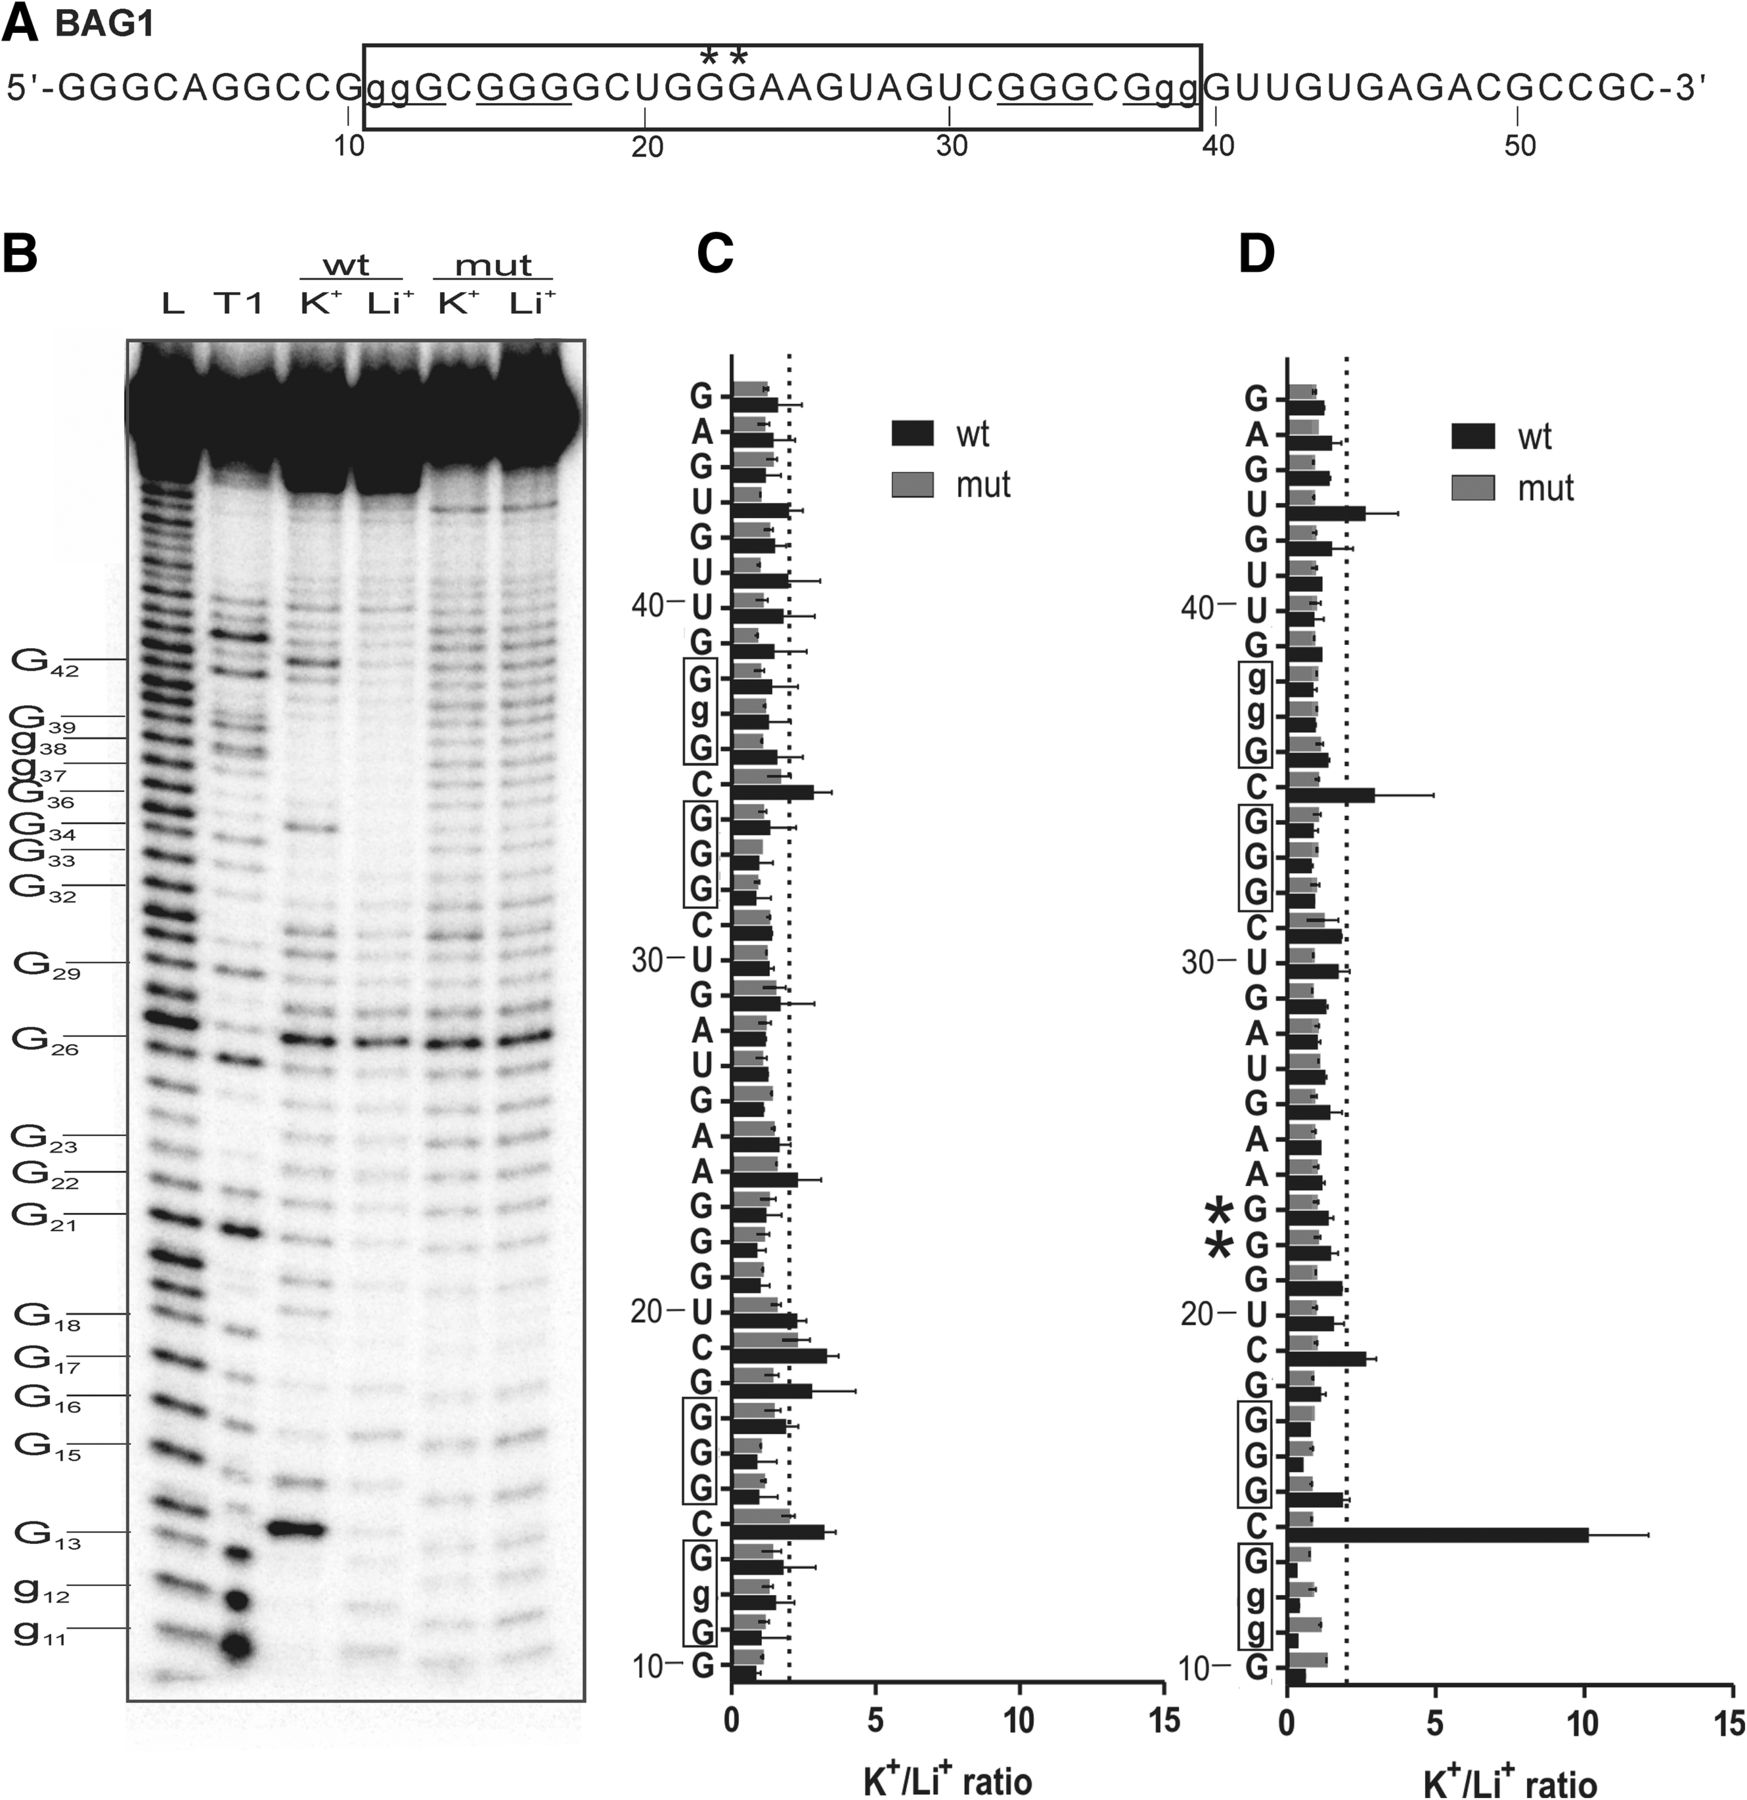
In-line probing results of the BAG1 PG4 candidate which possesses a 14-nt-long central loop. (A) Nucleotide sequence of the characterized BAG1 wt transcript. The lowercase guanines (g) correspond to those substituted for adenines in the G/A-mutant versions. Guanines mutated in the central loop are denoted by asterisks (*). Underlined G-tracks indicate the nucleotides predicted to be involved in the G-quadruplex formation. The boxed sequence denotes the predicted PG4. (B) Autoradiogram of a 10% denaturing (8 M urea) polyacrylamide gel of the in-line probing of both the 5′-labelled BAG1 wt and G/A-mutant PG4 versions performed in the presence of 100 mM of either LiCl or KCl. Lanes L and T1 indicate the alkaline hydrolysis and ribonuclease T1 mapping lanes, respectively. The positions of the guanines are indicated on the left of the gel. The lowercase guanines were converted to adenines in the mutant version. (C,D) K+/Li+ ratios of the band intensities of the BAG1 wt and the G/A-mutant for each nucleotide. The K+/Li+ ratios are shown in dark gray for BAG1 wt and in light gray for the BAG1 G/A-mutant. The boxed guanines represent the predicted G-tracks. The dotted line represents the twofold threshold that denotes a significant gain in flexibility. The sequence is indicated on the y-axis. The lowercase Gs shown on the y-axis are mutated to As in the mutant version. The asterisk (*) indicates guanines mutated to adenines in the central loop. Each bar represents the average of two independent experiments, and the error bars represent the standard deviations.




