


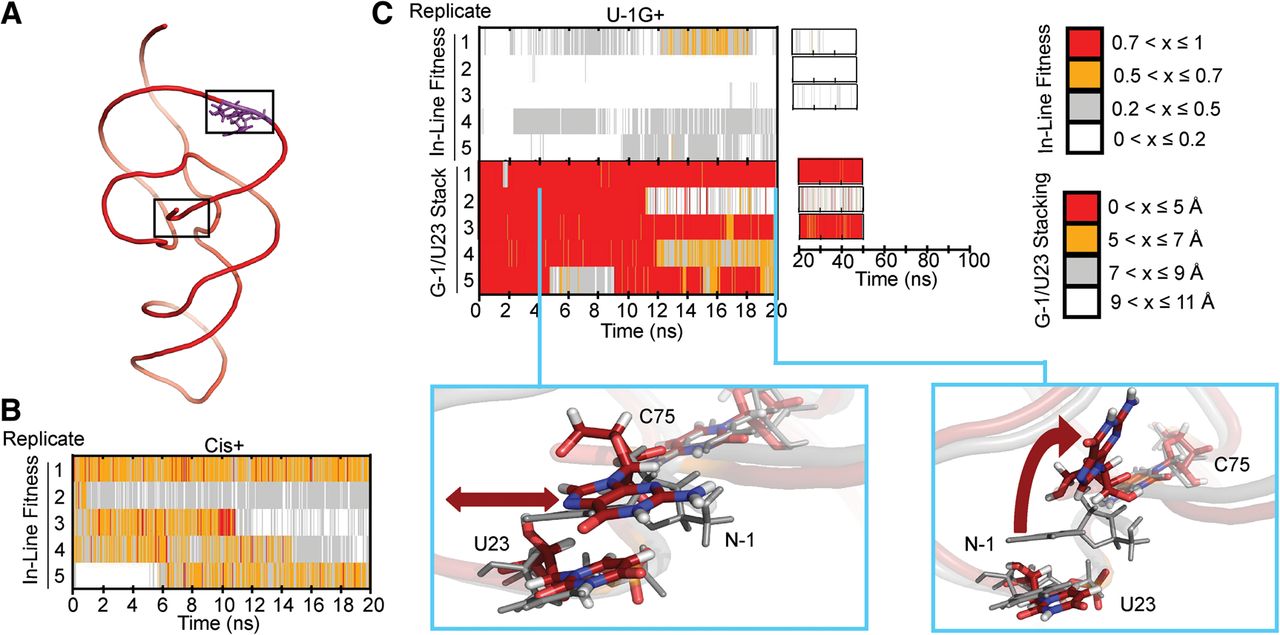
Simulating a cis-acting precursor model and a U-1G mutant. (A) Global structure of our Cis+ simulations. Modeled-in residues are denoted in purple. (B) In-line fitness of our Cis+ simulations. (C) In-line fitness (top plot), stacking behavior (middle plot), and representative stacking snapshots (bottom images) of our U-1G+ simulations. Stacking distances were calculated as the distance between the center of mass of U23 heavy ring atoms, and the center of mass of G-1 atoms C4 and C5. Both snapshots overlay a snapshot from the U-1+ simulation to contrast the stacking behavior. The red double-headed arrow in the left snapshot indicates the ability of G-1 to slide. The curved arrow in the right snapshot depicts the “flipping up” movement of G-1 as it unstacks. The U-1G+ snapshots are in color, while the U-1+ snapshot is in transparent gray. Relevant residues are shown in sticks and thickened lines. Atom colors are as described in Figure 3. The cyan lines in the middle plot denote from which replicate and at what times the snapshots were taken.




